Note
Go to the end to download the full example code.
Calculate and Plot Composite Reflectivity#
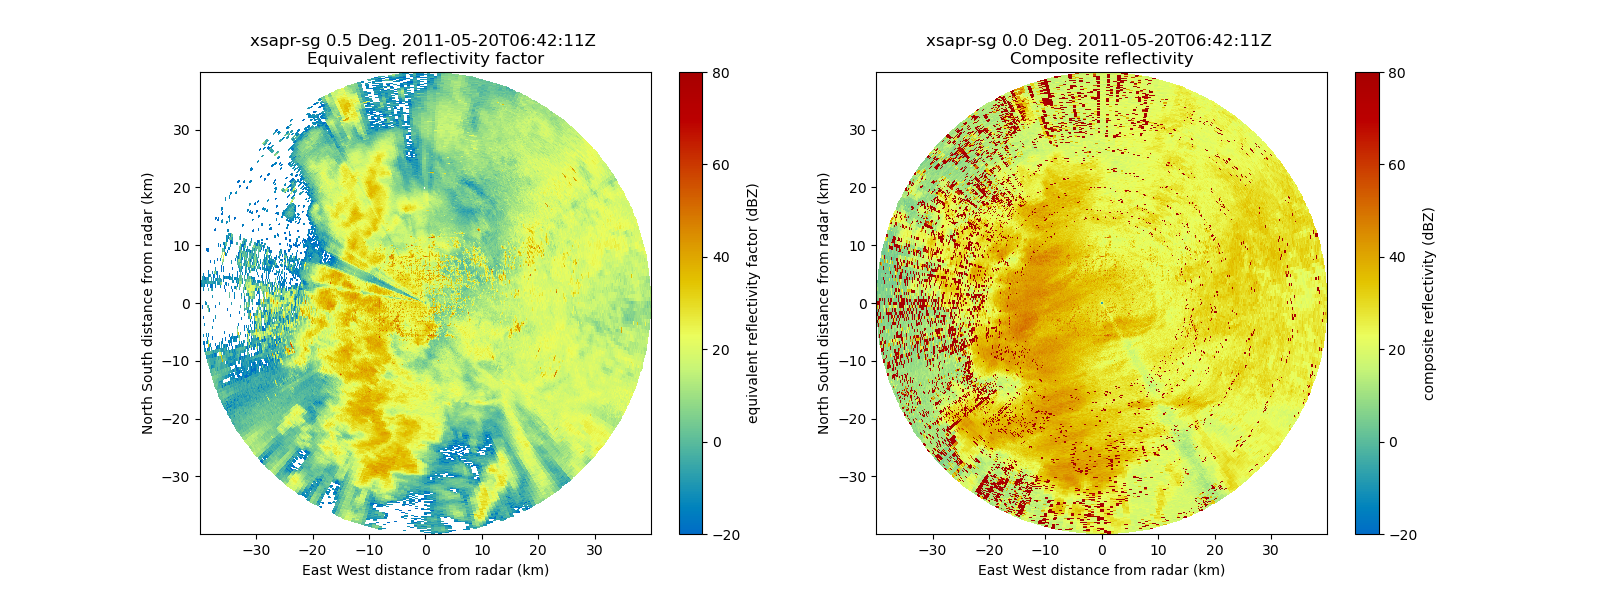
Calculates and plots the composite reflectivity, or the maximum reflectivity across all of the elevations.

# Author: Maxwell Grover (mgrover@anl.gov)
# License: BSD 3 clause

import matplotlib.pyplot as plt

import pyart
from pyart.testing import get_test_data

# Read in a sample file
filename = get_test_data("swx_20120520_0641.nc")
radar = pyart.io.read(filename)

# Configure a gatefilter to filter out copolar correlation coefficient values > 0.9
gatefilter = pyart.filters.GateFilter(radar)
gatefilter.exclude_transition()
gatefilter.exclude_below("copol_coeff", 0.9)

# Calculate composite reflectivity, or the maximum reflectivity across all elevation levels
compz = pyart.retrieve.composite_reflectivity(
    radar, field="reflectivity_horizontal", gatefilter=gatefilter
)

# Plot the original reflectivity field and the composite field
fig = plt.figure(figsize=(16, 6))
ax = plt.subplot(121)
display = pyart.graph.RadarDisplay(radar)
display.plot("reflectivity_horizontal", ax=ax, vmin=-20, vmax=80)

ax2 = plt.subplot(122)
composite_display = pyart.graph.RadarDisplay(compz)
composite_display.plot(
    "composite_reflectivity", ax=ax2, vmin=-20, vmax=80, cmap="HomeyerRainbow"
)
Total running time of the script: (0 minutes 3.047 seconds)