Example Gallery#
The files used in these examples are available for download.
Moment correction examples#
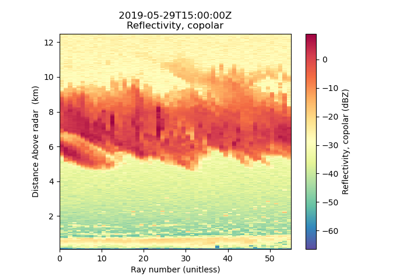
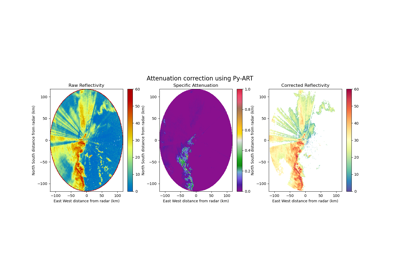
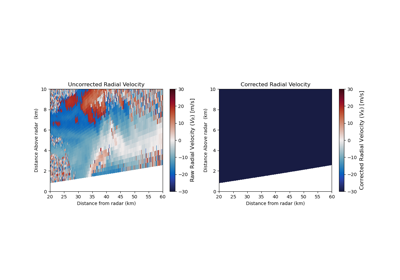
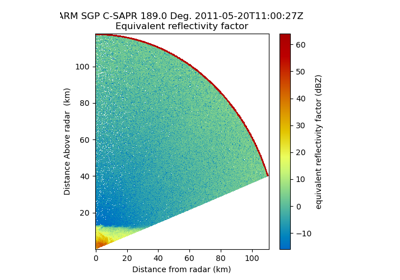
Performing radar moment corrections in antenna (radial) coordinates.
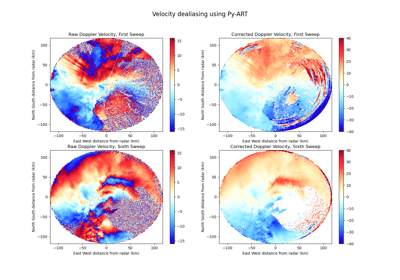
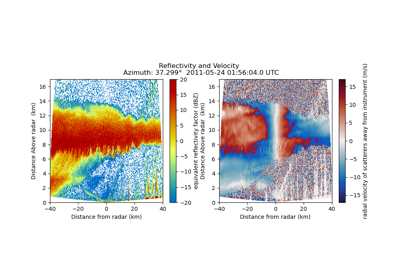
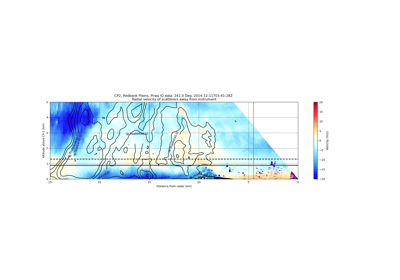
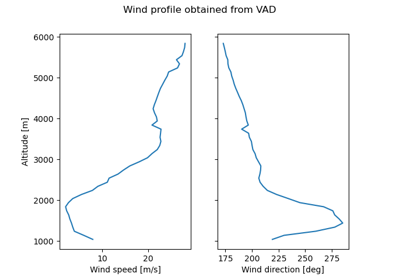
Dealias doppler velocities using the Region Based Algorithm
Input/Output Examples#
Reading/writing a variety of radar data using Py-ART.
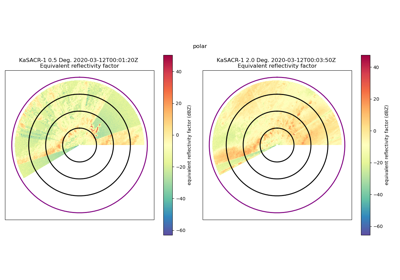
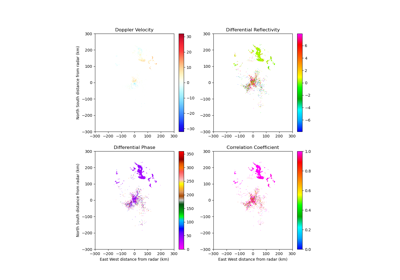
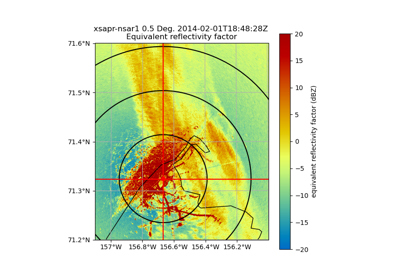
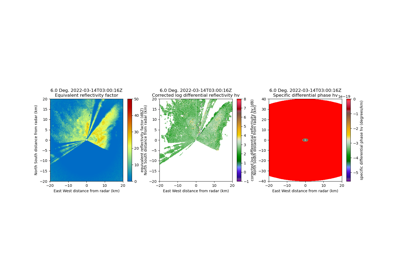
Read and Plot Cfradial2/FM301 data Using Xradar and Py-ART
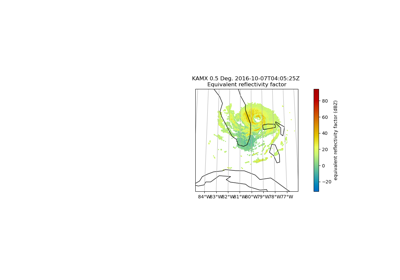
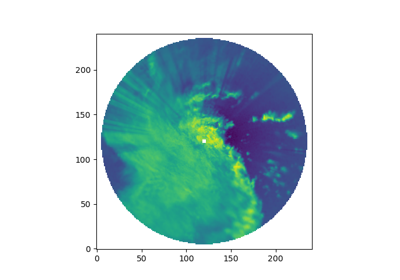
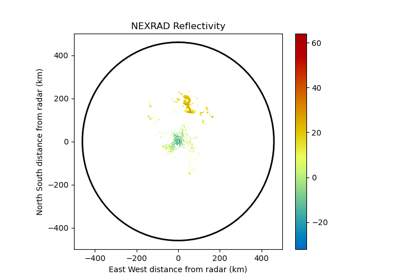
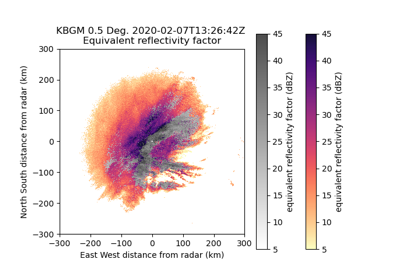
Reading Older NEXRAD Data and Fixing Latitude and Longitude Issues
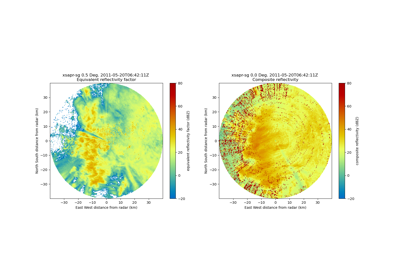
Mapping examples#
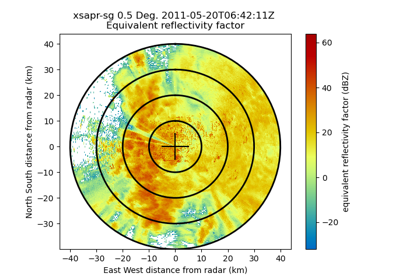
Mapping one or multiple radars from antenna coordinates to a Cartesian grid.
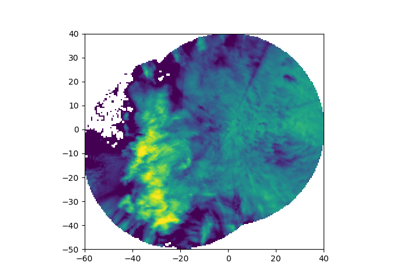
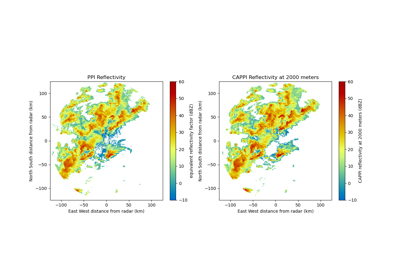
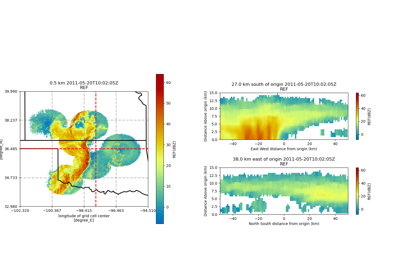
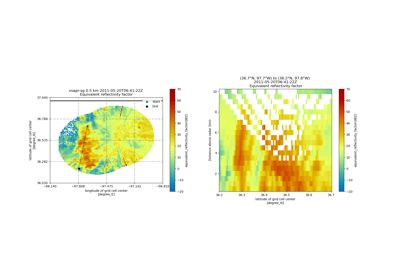
Map a single PPI sweep to a Cartesian grid using 2D weighting
Plotting examples#
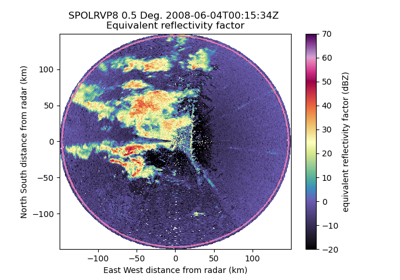
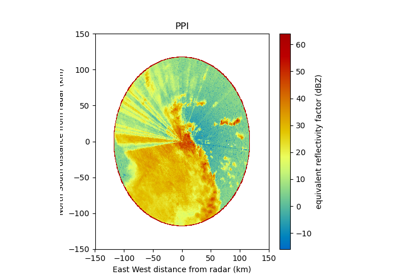
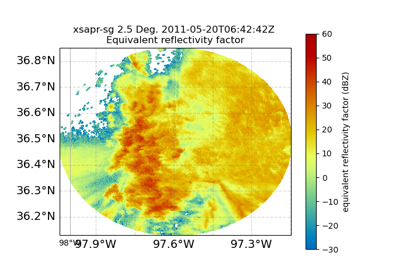
Plotting real world radar data with Py-ART.
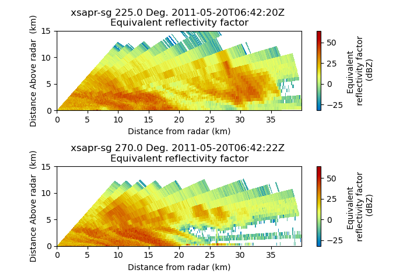
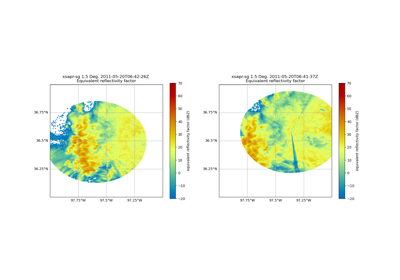
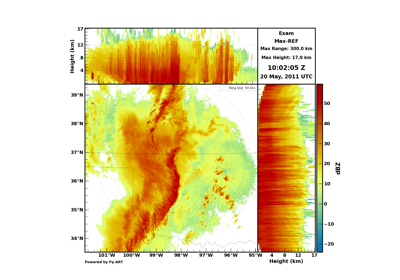
Create a multiple panel RHI plot from a CF/Radial file
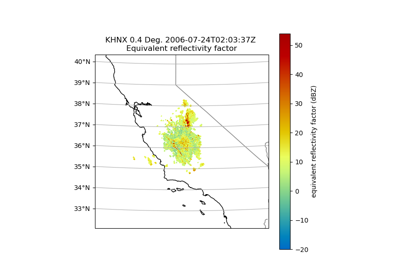
Create a plot of multiple moments from a NEXRAD file
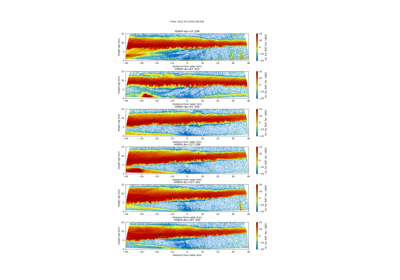
Create a multiple panel RHI plot from a CF/Radial file
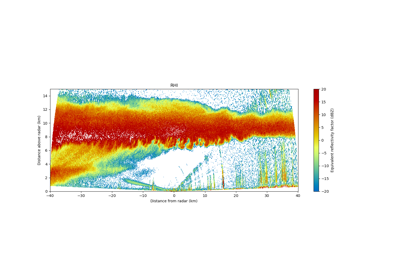
Create an RHI plot with reflectivity contour lines from an MDV file
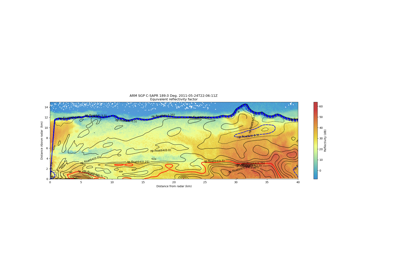
Create an RHI plot with reflectivity contour lines from an MDV file
Retrieval Examples#
Retrievals from various radars, such as additional fields or subsets of the data.
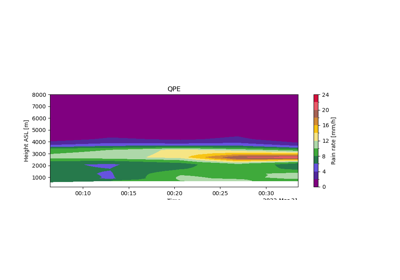
Radar-Based Quantitative Precipitation Estimation (QPE)
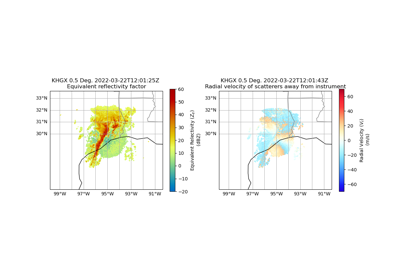
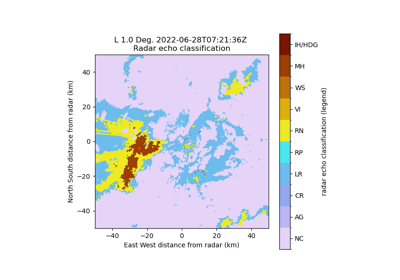
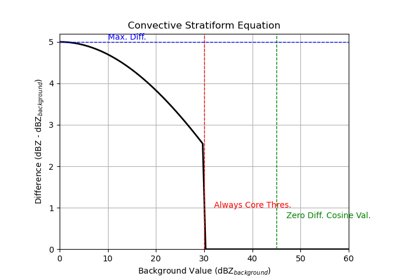
Hydrometeor Classification with Custom Frequency Settings
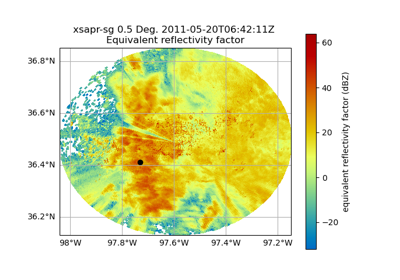
Xradar Examples#
Examples of using Xradar with Py-ART to accomplish different tasks.