Plot Dual Doppler Output
Contents
Plot Dual Doppler Output
import xarray as xr
import matplotlib.pyplot as plt
import pyart
import pandas as pd
import geopandas as gpd
import cartopy.crs as ccrs
import numpy as np
from shapely import wkt
def calc_updraft_area(vert_vel, threshold=2):
    """
    Plots vertical profile of updraft area
    """

    levels = vert_vel.z.values
    areas = []

    for lev in levels:

        # Subset for given level
        w_sub = vert_vel.sel(z=lev).values

        # Calculate area by summing pixels exceeding threshold and multiply by area (.25 km2)
        areas.append(len(w_sub[np.where(w_sub > threshold)]) * .25)

    areas = np.array(areas)

    return areas, levels
0226 UTC
ds = xr.open_dataset('dual_output/Nov12/new_cleaning/Nov12_0224.nc').squeeze()
w_vals = ds.where((ds.w > 0) & (ds.lat > -31.2) & (ds.lat < -31.13) & (ds.lon > -64.) & (ds.lon < -63.92)).sel(z=slice(5000, 12000)).w
w = ds.where((ds.w > 0) & (ds.lat > -31.2) & (ds.lat < -31.13) & (ds.lon > -64.) & (ds.lon < -63.92)).sel(z=slice(5000, 12000)).w.mean(dim='z').values
w_max = ds.where((ds.w > 0) & (ds.lat > -31.2) & (ds.lat < -31.13) & (ds.lon > -64.) & (ds.lon < -63.92)).sel(z=slice(5000, 12000)).w.max(dim=['x','y'])
ref = ds.sel(z=1500).ZM_composite.values
areas1, levels = calc_updraft_area(w_vals, 2)
wmax1 = w_max
/Users/mgrover/miniconda3/envs/unidata/lib/python3.7/site-packages/ipykernel_launcher.py:15: RuntimeWarning: invalid value encountered in greater
  from ipykernel import kernelapp as app
plt.figure(figsize=(20,8))
ax = plt.subplot(121)

ax.plot(wmax1, levels, label='0226 UTC', color='tab:blue')
ax.plot(wmax2, levels, label='0232 UTC', color='tab:orange')
ax.plot(wmax3, levels, label='0236 UTC', color='tab:green')

plt.xticks(fontsize=12)
plt.yticks(fontsize=12)

plt.xlabel('$W_{max}$ (m/s)', fontsize=16)
plt.ylabel('Height (km)', fontsize=16)

plt.legend(loc='upper left', fontsize=14)

plt.title('12 November 2018 $w_{max}$ Vertical Profiles', fontsize=18)

ax2 = plt.subplot(122)

ax2.plot(areas1, levels, label='0226 UTC', color='tab:blue')
ax2.plot(areas2, levels, label='0232 UTC', color='tab:orange')
ax2.plot(areas3, levels, label='0236 UTC', color='tab:green')

plt.xticks(fontsize=12)
plt.yticks(fontsize=12)

plt.xlabel('$W_{area}$ ($km^2$)', fontsize=16)
plt.ylabel('Height (km)', fontsize=16)

plt.legend(loc='upper left', fontsize=14)

plt.title('12 November 2018 $w_{area}$ Vertical Profiles', fontsize=18)
---------------------------------------------------------------------------
NameError                                 Traceback (most recent call last)
<ipython-input-7-030845936181> in <module>
      3
      4 ax.plot(wmax1, levels, label='0226 UTC', color='tab:blue')
----> 5 ax.plot(wmax2, levels, label='0232 UTC', color='tab:orange')
      6 ax.plot(wmax3, levels, label='0236 UTC', color='tab:green')
      7

NameError: name 'wmax2' is not defined
plt.plot(wmax1, levels, label='0226 UTC')
plt.plot(wmax2, levels, label='0232 UTC')
plt.plot(wmax3, levels, label='0236 UTC')

plt.legend()
---------------------------------------------------------------------------
NameError                                 Traceback (most recent call last)
<ipython-input-7-be93dee9bc90> in <module>
      1 plt.plot(wmax1, levels, label='0226 UTC')
----> 2 plt.plot(wmax2, levels, label='0232 UTC')
      3 plt.plot(wmax3, levels, label='0236 UTC')
      4
      5 plt.legend()

NameError: name 'wmax2' is not defined
ds = xr.open_dataset('dual_output/Nov12/new_cleaning/Nov12_0220.nc').squeeze()
df = pd.read_csv('../radar_data_cleaning/Nov_12_2018_0227_0237_OTs.csv')
df['geometry'] = df['geometry'].apply(wkt.loads)
geo_df = gpd.GeoDataFrame(df, geometry='geometry')

lat_min = -31.19
lat_max = -31.13
lon_min = -63.8
lon_max = -63.7

ot_df = geo_df[df.minute == 27]

ota = ot_df.area_polygon.values

ot_lon = ot_df.centroid.x.values[0]
ot_lat = ot_df.centroid.y.values[0]

shift_x = ot_df.lon_corr.values[0] - ot_lon
shift_y = ot_df.lat_corr.values[0] - ot_lat

ot_df = ot_df.translate(shift_x, shift_y)

lats = ds.lat.values
lons = ds.lon.values

w_vals = ds.where((ds.w > 0) & (ds.lat > lat_min) & (ds.lat < lat_max) & (ds.lon > lon_min) & (ds.lon < lon_max)).sel(z=slice(5000, 10000)).w
w = ds.where((ds.w > 0) & (ds.lat > lat_min) & (ds.lat < lat_max) & (ds.lon > lon_min) & (ds.lon < lon_max)).sel(z=slice(5000, 10000)).w.mean(dim='z').values
w_max = ds.where((ds.w > 0) & (ds.lat > -31.25) & (ds.lat < -31.2) & (ds.lon > -64.) & (ds.lon < -63.9)).sel(z=slice(5000, 10000)).w.max(dim=['x','y'])
ref = ds.sel(z=3000).ZM_composite.values

area = len(w[np.where(w > 6)]) * .25
areas1, levels = calc_updraft_area(w_vals, 6)
wmax1 = w_max
/Users/mgrover/miniconda3/envs/unidata/lib/python3.7/site-packages/ipykernel_launcher.py:31: RuntimeWarning: invalid value encountered in greater
/Users/mgrover/miniconda3/envs/unidata/lib/python3.7/site-packages/ipykernel_launcher.py:15: RuntimeWarning: invalid value encountered in greater
  from ipykernel import kernelapp as app
fig = plt.figure(figsize=(12,8))
ax = plt.subplot(111, projection=ccrs.PlateCarree())
cf = plt.pcolormesh(lons, lats,ref , vmin=10, vmax=60, cmap='pyart_HomeyerRainbow')
cb1 = plt.colorbar(cf, shrink=.7)
cb1.set_label('Reflectivity (dBZ)', fontsize=16)
cb1.ax.tick_params(labelsize=16)
#q = ax.quiver(lons[::2], lats[::2], u_wnd[::2], v_wnd[::2], pivot='mid', color='black', scale=50, scale_units='inches')
#ax.quiverkey(q, X=.95, Y=.1, U=10, label='10 m/s', labelpos='W')
w_mask = np.nan_to_num(w)
cf = plt.contour(lons, lats, w_mask , levels=[5, 30], colors=['black'], linestyles='dashed')
#plt.colorbar(cf, label='Vertical Velocity (m/s)', shrink=.7)
#ot_df.plot(ax=ax, facecolor="none",
# edgecolor='black',linewidth=3, label='otarea')
gl = ax.gridlines(crs=ccrs.PlateCarree(), draw_labels=True,
linewidth=2, color='gray', alpha=0.5, linestyle='--')
gl.top_labels = False
gl.left_labels= True
gl.right_labels = False
ax.set_extent((-64.25, -63.65, -31.5, -31.))
#plt.plot(0,0, color='black', label=f'OT Area: {ota[0].round(2)} $km^{2}$ ', linewidth=3)
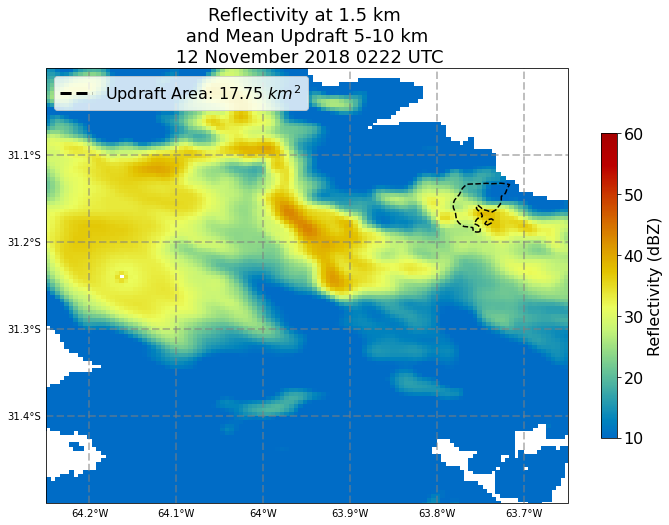
plt.plot(0,0, color='black', label=f'Updraft Area: {area} $km^{2}$', linewidth=3, linestyle='--')
plt.legend(loc='upper left', fontsize=16)
plt.title('Reflectivity at 1.5 km \n and Mean Updraft 5-10 km \n 12 November 2018 0222 UTC', fontsize=18)
Text(0.5, 1.0, 'Reflectivity at 1.5 km \n and Mean Updraft 5-10 km \n 12 November 2018 0222 UTC')
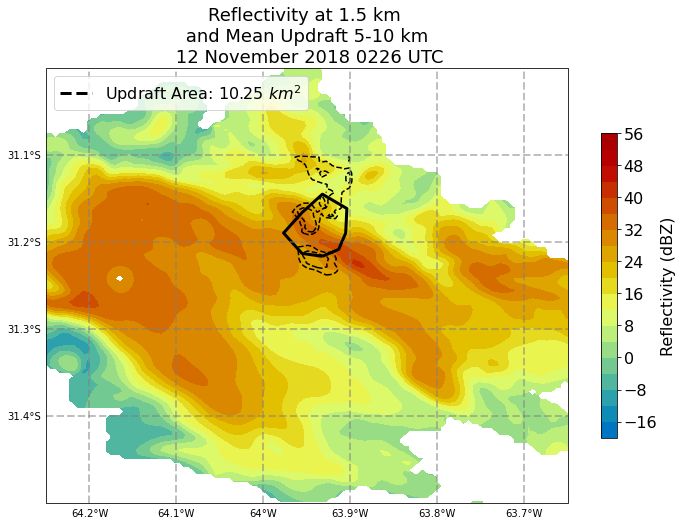
ds = xr.open_dataset('dual_output/Nov12/new_cleaning/Nov12_0224.nc').squeeze()
df = pd.read_csv('../radar_data_cleaning/Nov_12_2018_0227_0237_OTs.csv')
df['geometry'] = df['geometry'].apply(wkt.loads)
geo_df = gpd.GeoDataFrame(df, geometry='geometry')

lat_min = -31.25
lat_max = -31.16
lon_min = -63.8
lon_max = -63.65

ot_df = geo_df[df.minute == 27]

ota = ot_df.area_polygon.values

ot_lon = ot_df.centroid.x.values[0]
ot_lat = ot_df.centroid.y.values[0]

shift_x = ot_df.lon_corr.values[0] - ot_lon
shift_y = ot_df.lat_corr.values[0] - ot_lat

ot_df = ot_df.translate(shift_x, shift_y)

lats = ds.lat.values
lons = ds.lon.values

w_vals = ds.where((ds.w > 0) & (ds.lat > lat_min) & (ds.lat < lat_max) & (ds.lon > lon_min) & (ds.lon < lon_max)).sel(z=slice(5000, 10000)).w
w = ds.where((ds.w > 0) & (ds.lat > lat_min) & (ds.lat < lat_max) & (ds.lon > lon_min) & (ds.lon < lon_max)).sel(z=slice(5000, 10000)).w.mean(dim='z').values
w_max = ds.where((ds.w > 0) & (ds.lat > lat_min) & (ds.lat < lat_max) & (ds.lon > lon_min) & (ds.lon < lon_max)).sel(z=slice(5000, 10000)).w.max(dim=['x','y'])
ref = ds.sel(z=3000).ZM_composite.values

area = len(w[np.where(w > 6)]) * .25
areas2, levels = calc_updraft_area(w_vals, 6)
wmax2 = w_max
/Users/mgrover/miniconda3/envs/unidata/lib/python3.7/site-packages/ipykernel_launcher.py:31: RuntimeWarning: invalid value encountered in greater
/Users/mgrover/miniconda3/envs/unidata/lib/python3.7/site-packages/ipykernel_launcher.py:15: RuntimeWarning: invalid value encountered in greater
  from ipykernel import kernelapp as app
fig = plt.figure(figsize=(12,8))
ax = plt.subplot(111, projection=ccrs.PlateCarree())
cf = plt.pcolormesh(lons, lats,ref , vmin=10, vmax=60, cmap='pyart_HomeyerRainbow')
cb1 = plt.colorbar(cf, shrink=.7)
cb1.set_label('Reflectivity (dBZ)', fontsize=16)
cb1.ax.tick_params(labelsize=16)
#q = ax.quiver(lons[::2], lats[::2], u_wnd[::2], v_wnd[::2], pivot='mid', color='black', scale=50, scale_units='inches')
#ax.quiverkey(q, X=.95, Y=.1, U=10, label='10 m/s', labelpos='W')
w_mask = np.nan_to_num(w)
cf = plt.contour(lons, lats, w_mask , levels=[5, 30], colors=['black'], linestyles='dashed')
#plt.colorbar(cf, label='Vertical Velocity (m/s)', shrink=.7)
ot_df.plot(ax=ax, facecolor="none",
edgecolor='black',linewidth=3, label='otarea')
gl = ax.gridlines(crs=ccrs.PlateCarree(), draw_labels=True,
linewidth=2, color='gray', alpha=0.5, linestyle='--')
gl.top_labels = False
gl.left_labels= True
gl.right_labels = False
ax.set_extent((-64.25, -63.65, -31.5, -31.))
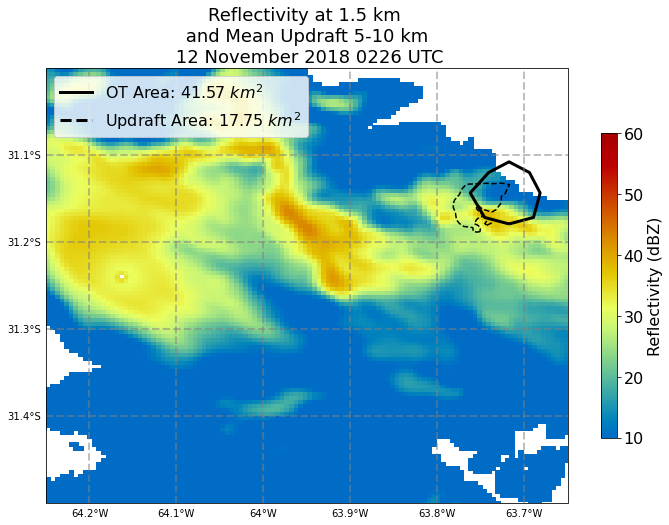
plt.plot(0,0, color='black', label=f'OT Area: {ota[0].round(2)} $km^{2}$ ', linewidth=3)
plt.plot(0,0, color='black', label=f'Updraft Area: {area} $km^{2}$', linewidth=3, linestyle='--')
plt.legend(loc='upper left', fontsize=16)
plt.title('Reflectivity at 1.5 km \n and Mean Updraft 5-10 km \n 12 November 2018 0226 UTC', fontsize=18)
Text(0.5, 1.0, 'Reflectivity at 1.5 km \n and Mean Updraft 5-10 km \n 12 November 2018 0226 UTC')
ds = xr.open_dataset('dual_output/Nov12/new_cleaning/Nov12_0230.nc').squeeze()
df = pd.read_csv('../radar_data_cleaning/Nov_12_2018_0227_0237_OTs.csv')
df['geometry'] = df['geometry'].apply(wkt.loads)
geo_df = gpd.GeoDataFrame(df, geometry='geometry')

lat_min = -31.3
lat_max = -31.22
lon_min = -63.8
lon_max = -63.66

ot_df = geo_df[df.minute == 31]

ota = ot_df.area_polygon.values

ot_lon = ot_df.centroid.x.values[0]
ot_lat = ot_df.centroid.y.values[0]

shift_x = ot_df.lon_corr.values[0] - ot_lon
shift_y = ot_df.lat_corr.values[0] - ot_lat

ot_df = ot_df.translate(shift_x, shift_y)

lats = ds.lat.values
lons = ds.lon.values

w_vals = ds.where((ds.w > 0) & (ds.lat > lat_min) & (ds.lat < lat_max) & (ds.lon > lon_min) & (ds.lon < lon_max)).sel(z=slice(5000, 10000)).w
w = ds.where((ds.w > 0) & (ds.lat > lat_min) & (ds.lat < lat_max) & (ds.lon > lon_min) & (ds.lon < lon_max)).sel(z=slice(5000, 10000)).w.mean(dim='z').values
w_max = ds.where((ds.w > 0) & (ds.lat > lat_min) & (ds.lat < lat_max) & (ds.lon > lon_min) & (ds.lon < lon_max)).sel(z=slice(5000, 10000)).w.max(dim=['x','y'])
ref = ds.sel(z=3000).ZM_composite.values

area = len(w[np.where(w > 6)]) * .25
areas3, levels = calc_updraft_area(w_vals, 6)
wmax3 = w_max
/Users/mgrover/miniconda3/envs/unidata/lib/python3.7/site-packages/ipykernel_launcher.py:31: RuntimeWarning: invalid value encountered in greater
/Users/mgrover/miniconda3/envs/unidata/lib/python3.7/site-packages/ipykernel_launcher.py:15: RuntimeWarning: invalid value encountered in greater
  from ipykernel import kernelapp as app
fig = plt.figure(figsize=(12,8))
ax = plt.subplot(111, projection=ccrs.PlateCarree())
cf = plt.pcolormesh(lons, lats,ref , vmin=10, vmax=50, cmap='pyart_HomeyerRainbow')
cb1 = plt.colorbar(cf, shrink=.7)
cb1.set_label('Reflectivity (dBZ)', fontsize=16)
cb1.ax.tick_params(labelsize=16)
#q = ax.quiver(lons[::2], lats[::2], u_wnd[::2], v_wnd[::2], pivot='mid', color='black', scale=50, scale_units='inches')
#ax.quiverkey(q, X=.95, Y=.1, U=10, label='10 m/s', labelpos='W')
w_mask = np.nan_to_num(w)
cf = plt.contour(lons, lats, w_mask , levels=[5, 30], colors=['black'], linestyles='dashed')
#plt.colorbar(cf, label='Vertical Velocity (m/s)', shrink=.7)
ot_df.plot(ax=ax, facecolor="none",
edgecolor='black',linewidth=3, label='otarea')
gl = ax.gridlines(crs=ccrs.PlateCarree(), draw_labels=True,
linewidth=2, color='gray', alpha=0.5, linestyle='--')
gl.top_labels = False
gl.left_labels= True
gl.right_labels = False
ax.set_extent((-64.25, -63.65, -31.5, -31.))
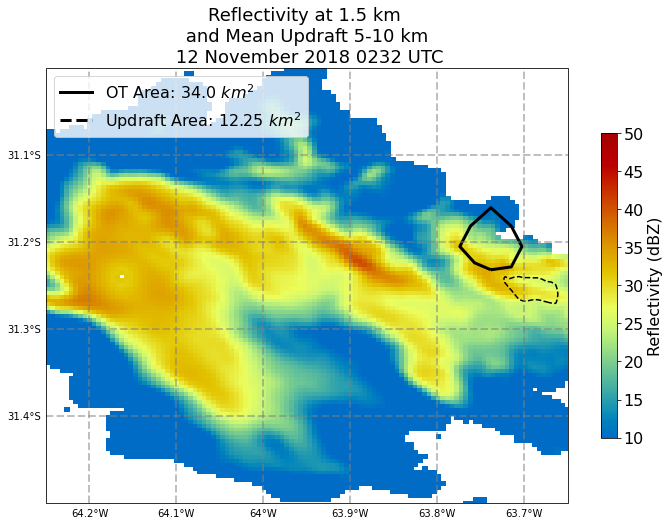
plt.plot(0,0, color='black', label=f'OT Area: {ota[0].round(2)} $km^{2}$ ', linewidth=3)
plt.plot(0,0, color='black', label=f'Updraft Area: {area} $km^{2}$', linewidth=3, linestyle='--')
plt.legend(loc='upper left', fontsize=16)
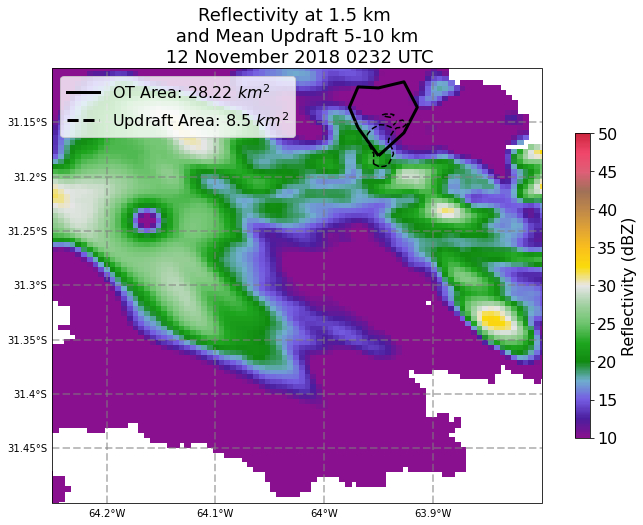
plt.title('Reflectivity at 1.5 km \n and Mean Updraft 5-10 km \n 12 November 2018 0232 UTC', fontsize=18)
Text(0.5, 1.0, 'Reflectivity at 1.5 km \n and Mean Updraft 5-10 km \n 12 November 2018 0232 UTC')
plt.figure(figsize=(20,8))
ax = plt.subplot(121)

ax.plot(wmax1, levels, label='0222 UTC', color='tab:blue')
ax.plot(wmax2, levels, label='0226 UTC', color='tab:orange')
ax.plot(wmax3, levels, label='0232 UTC', color='tab:green')

plt.xticks(fontsize=12)
plt.yticks(fontsize=12)

plt.xlabel('$W_{max}$ (m/s)', fontsize=16)
plt.ylabel('Height (km)', fontsize=16)

plt.legend(loc='upper left', fontsize=14)

plt.title('12 November 2018 $w_{max}$ Vertical Profiles', fontsize=18)

ax2 = plt.subplot(122)

ax2.plot(areas1, levels, label='0222 UTC', color='tab:blue')
ax2.plot(areas2, levels, label='0226 UTC', color='tab:orange')
ax2.plot(areas3, levels, label='0232 UTC', color='tab:green')

plt.xticks(fontsize=12)
plt.yticks(fontsize=12)

plt.xlabel('$W_{area}$ ($km^2$)', fontsize=16)
plt.ylabel('Height (km)', fontsize=16)

plt.legend(loc='upper left', fontsize=14)

plt.title('12 November 2018 $w_{area}$ Vertical Profiles', fontsize=18)
---------------------------------------------------------------------------
NameError                                 Traceback (most recent call last)
<ipython-input-19-4cc26b9ec3f9> in <module>
      3
      4 ax.plot(wmax1, levels, label='0222 UTC', color='tab:blue')
----> 5 ax.plot(wmax2, levels, label='0226 UTC', color='tab:orange')
      6 ax.plot(wmax3, levels, label='0232 UTC', color='tab:green')
      7

NameError: name 'wmax2' is not defined
ds = xr.open_dataset('dual_output/Nov12/new_cleaning/Nov12_0244.nc').squeeze()
#df = pd.read_csv('../radar_data_cleaning/Nov_12_2018_0227_0237_OTs.csv')
df = pd.read_csv('ot_output/Revised_OTs_12_Nov_2018_0232_0243.csv')
df['time'] = pd.to_datetime(df.time)
df['minute'] = df.time.dt.minute
df['geometry'] = df['geometry'].apply(wkt.loads)
geo_df = gpd.GeoDataFrame(df, geometry='geometry')
lat_min = -31.4
lat_max = -31.15
lon_min = -64.3
lon_max = -63.9
ot_df = geo_df[df.minute == 44]
ota = ot_df.area_circle_polygon.values
ot_lon = ot_df.centroid.x.values[0]
ot_lat = ot_df.centroid.y.values[0]
shift_x = ot_df.lon_corr.values[0] - ot_lon
shift_y = ot_df.lat_corr.values[0] - ot_lat
ot_df = ot_df.translate(shift_x, shift_y)
lats = ds.lat.values
lons = ds.lon.values
w_vals = ds.where((ds.w > 0) & (ds.lat > lat_min) & (ds.lat < lat_max) & (ds.lon > lon_min) & (ds.lon < lon_max)).sel(z=slice(5000, 8000)).w
w = ds.where((ds.w > 0) & (ds.lat > lat_min) & (ds.lat < lat_max) & (ds.lon > lon_min) & (ds.lon < lon_max)).sel(z=slice(5000, 10000)).w.mean(dim='z').values
w_max = ds.where((ds.w > 0) & (ds.lat > lat_min) & (ds.lat < lat_max) & (ds.lon > lon_min) & (ds.lon < lon_max)).sel(z=slice(5000, 10000)).w.max(dim=['x','y'])
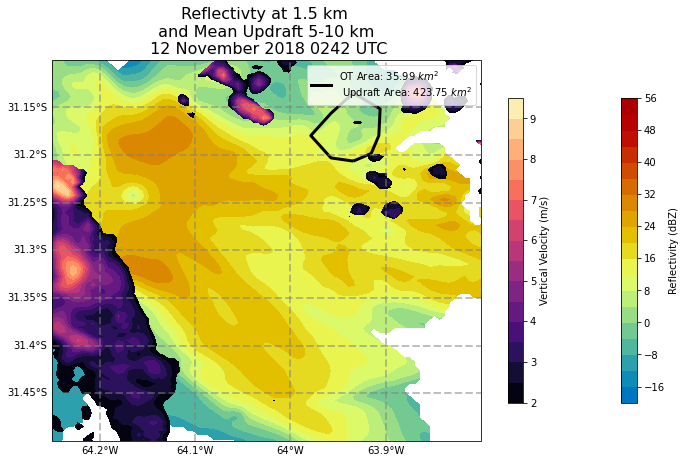
ref = ds.sel(z=1500).ZM_composite.values
area = len(w[np.where(w > 2)]) * .25
---------------------------------------------------------------------------
IndexError                                Traceback (most recent call last)
<ipython-input-46-c6cbba4db03b> in <module>
     16 ota = ot_df.area_circle_polygon.values
     17
---> 18 ot_lon = ot_df.centroid.x.values[0]
     19 ot_lat = ot_df.centroid.y.values[0]
     20

IndexError: index 0 is out of bounds for axis 0 with size 0
np.nanpercentile(w, 70)
2.9094482063830123
fig = plt.figure(figsize=(12,8))

ax = plt.subplot(111, projection=ccrs.PlateCarree())

cf = plt.pcolormesh(lons, lats,ref , vmin=10, vmax=50, cmap='pyart_HomeyerRainbow')
cb1 = plt.colorbar(cf, shrink=.7)
cb1.set_label('Reflectivity (dBZ)', fontsize=16)
cb1.ax.tick_params(labelsize=16)

#q = ax.quiver(lons[::2], lats[::2], u_wnd[::2], v_wnd[::2], pivot='mid', color='black', scale=50, scale_units='inches')

#ax.quiverkey(q, X=.95, Y=.1, U=10, label='10 m/s', labelpos='W')

w_mask = np.nan_to_num(w)
cf = plt.contour(lons, lats, w_mask , levels=[2, 6, 12], colors=['black'], linestyles='dashed')
#plt.colorbar(cf, label='Vertical Velocity (m/s)', shrink=.7)

ot_df.plot(ax=ax, facecolor="none",
              edgecolor='black',linewidth=3, label='otarea')

gl = ax.gridlines(crs=ccrs.PlateCarree(), draw_labels=True,
                  linewidth=2, color='gray', alpha=0.5, linestyle='--')
gl.top_labels = False
gl.left_labels= True
gl.right_labels = False

ax.set_extent((-64.25, -63.65, -31.5, -31.))

plt.plot(0,0, color='black', label=f'OT Area: {ota[0].round(2)} $km^{2}$ ', linewidth=3)
plt.plot(0,0, color='black', label=f'Updraft Area: {area} $km^{2}$', linewidth=3, linestyle='--')

plt.legend(loc='upper left', fontsize=16)

plt.title('Reflectivity at 1.5 km \n and Mean Updraft 5-10 km \n 12 November 2018 0242 UTC', fontsize=18)
/Users/mgrover/miniconda3/envs/unidata/lib/python3.7/site-packages/geopandas/plotting.py:607: UserWarning: The GeoDataFrame you are attempting to plot is empty. Nothing has been displayed.
  UserWarning,
---------------------------------------------------------------------------
IndexError                                Traceback (most recent call last)
<ipython-input-48-bed59bee15f6> in <module>
     27 ax.set_extent((-64.25, -63.65, -31.5, -31.))
     28
---> 29 plt.plot(0,0, color='black', label=f'OT Area: {ota[0].round(2)} $km^{2}$ ', linewidth=3)
     30 plt.plot(0,0, color='black', label=f'Updraft Area: {area} $km^{2}$', linewidth=3, linestyle='--')
     31

IndexError: index 0 is out of bounds for axis 0 with size 0
df = pd.read_csv('ot_output/Revised_OTs_12_Nov_2018_0232_0243.csv', index_col='time', parse_dates=True)
df['ot_depth'] = df.cloudtop_height - df.tropopause_height

from datetime import timedelta
df.index = df.index + timedelta(minutes=1)
df['minute'] = df.index.minute
df['btd'] = df.tropopause_temperature - df.mintb
df.btd
time
2018-11-12 02:32:54.000000000    1.030014
2018-11-12 02:33:54.000000000   -0.869995
2018-11-12 02:34:54.000000000    2.240005
2018-11-12 02:35:54.000000000    3.010010
2018-11-12 02:38:54.000000000   -1.929993
2018-11-12 02:39:54.000000000   -1.179993
2018-11-12 02:40:54.000000000   -0.599991
2018-11-12 02:41:54.000001024   -2.479996
2018-11-12 02:42:54.000000000   -2.000000
2018-11-12 02:43:54.000000000   -1.580002
Name: btd, dtype: float64
df_sub = geo_df[df.minute == 33]
ot_df = df_sub[df_sub.lat == df_sub.lat.values[0]]

ot_lon = df_sub.lon.values[0]
ot_lat = df_sub.lat.values[0]

shift_x = ot_df.lon_corr.values[0] - ot_lon
shift_y = ot_df.lat_corr.values[0] - ot_lat
/Users/mgrover/miniconda3/envs/unidata/lib/python3.7/site-packages/geopandas/geodataframe.py:828: UserWarning: Boolean Series key will be reindexed to match DataFrame index.
  result = super(GeoDataFrame, self).__getitem__(key)
---------------------------------------------------------------------------
IndexingError                             Traceback (most recent call last)
<ipython-input-194-a828582516e4> in <module>
----> 1 df_sub = geo_df[df.minute == 33]
      2 ot_df = df_sub[df_sub.lat == df_sub.lat.values[0]]
      3
      4 ot_lon = df_sub.lon.values[0]
      5 ot_lat = df_sub.lat.values[0]

~/miniconda3/envs/unidata/lib/python3.7/site-packages/geopandas/geodataframe.py in __getitem__(self, key)
    826         GeoDataFrame.
    827         """
--> 828         result = super(GeoDataFrame, self).__getitem__(key)
    829         geo_col = self._geometry_column_name
    830         if isinstance(result, Series) and isinstance(result.dtype, GeometryDtype):

~/miniconda3/envs/unidata/lib/python3.7/site-packages/pandas/core/frame.py in __getitem__(self, key)
   2888         # Do we have a (boolean) 1d indexer?
   2889         if com.is_bool_indexer(key):
-> 2890             return self._getitem_bool_array(key)
   2891
   2892         # We are left with two options: a single key, and a collection of keys,

~/miniconda3/envs/unidata/lib/python3.7/site-packages/pandas/core/frame.py in _getitem_bool_array(self, key)
   2940         # check_bool_indexer will throw exception if Series key cannot
   2941         # be reindexed to match DataFrame rows
-> 2942         key = check_bool_indexer(self.index, key)
   2943         indexer = key.nonzero()[0]
   2944         return self._take_with_is_copy(indexer, axis=0)

~/miniconda3/envs/unidata/lib/python3.7/site-packages/pandas/core/indexing.py in check_bool_indexer(index, key)
   2183         if mask.any():
   2184             raise IndexingError(
-> 2185                 "Unalignable boolean Series provided as "
   2186                 "indexer (index of the boolean Series and of "
   2187                 "the indexed object do not match)."

IndexingError: Unalignable boolean Series provided as indexer (index of the boolean Series and of the indexed object do not match).
df.lat_corr.values[0]
-33.08235549926758
ds = xr.open_dataset('dual_output/Nov12/man_edited_Nov12_0230.nc').squeeze()
#ds = xr.open_dataset('dual_output/Nov12/new_cleaning/Nov12_0230.nc').squeeze()
from shapely import wkt

df['geometry'] = df['geometry'].apply(wkt.loads)
geo_df = gpd.GeoDataFrame(df, geometry='geometry')
df_sub = geo_df[df.minute == 32]
ot_df = df_sub[df_sub.lat == df_sub.lat.values[0]]
ota = ot_df.area_circle_polygon.values
ot_lon = df_sub.lon.values[0]
ot_lat = df_sub.lat.values[0]
ot_df = ot_df.translate(shift_x, shift_y)
lats = ds.lat.values
lons = ds.lon.values
w_vals = ds.where((ds.w > 0) & (ds.lat > -31.25) & (ds.lat < -31.2) & (ds.lon > -64.) & (ds.lon < -63.9)).sel(z=slice(3000, 12000)).w
areas1, levels = calc_updraft_area(w_vals, 2)
/Users/mgrover/miniconda3/envs/unidata/lib/python3.7/site-packages/ipykernel_launcher.py:15: RuntimeWarning: invalid value encountered in greater
  from ipykernel import kernelapp as app
plt.plot(areas1, levels)
[<matplotlib.lines.Line2D at 0x7fdad5c06c50>]
# (ds.lat > -31.2) & (ds.lat < -31.13) & (ds.lon > -64.1) & (ds.lon < -63.95)
w_vals = ds.where((ds.w > 0) & (ds.lat > -31.19) & (ds.lat < -31.14) & (ds.lon > -64.) & (ds.lon < -63.915)).sel(z=slice(3000, 12000)).w
w = ds.where((ds.w > 0) & (ds.lat > -31.19) & (ds.lat < -31.14) & (ds.lon > -64.) & (ds.lon < -63.915)).sel(z=slice(5000, 10000)).w.mean(dim='z').values
w_max = ds.where((ds.w > 0) & (ds.lat > -31.25) & (ds.lat < -31.19) & (ds.lon > -64.) & (ds.lon < -63.89)).sel(z=slice(3000, 12000)).w.max(dim=['x','y'])
ref = ds.sel(z=1500).ZM_composite.values

area = len(w[np.where(w > 2)]) * .25
mean_w = np.nanmean(w[np.where(w > 2)])
/Users/mgrover/miniconda3/envs/unidata/lib/python3.7/site-packages/ipykernel_launcher.py:7: RuntimeWarning: invalid value encountered in greater
  import sys
/Users/mgrover/miniconda3/envs/unidata/lib/python3.7/site-packages/ipykernel_launcher.py:8: RuntimeWarning: invalid value encountered in greater
print(mean_w)
3.3403468136993064
max_w = np.nanmax(w_max)
mean_w = np.nanmean(w_max)

max_w2 = np.nanmax(wmax_2)
mean_w2 = np.nanmean(wmax_2)
---------------------------------------------------------------------------
NameError                                 Traceback (most recent call last)
<ipython-input-39-3c218ed79a0d> in <module>
      2 mean_w = np.nanmean(w_max)
      3
----> 4 max_w2 = np.nanmax(wmax_2)
      5 mean_w2 = np.nanmean(wmax_2)

NameError: name 'wmax_2' is not defined
max_w
14.35641200781719
fig = plt.figure(figsize=(20,8))
ax = plt.subplot(121)
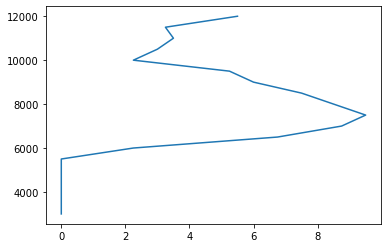
ax.plot(w_max.values, w_max.z, label='0232 UTC', color='tab:blue')
#plt.axvline(max_w, label=f'Max w in 5-10 km layer {np.round(max_w, 2)} m/s', linestyle='--', color='tab:blue')
#plt.axvline(mean_w, label=f'Mean w in 5-10 km layer {np.round(mean_w, 2)} m/s', linestyle=':', color='tab:blue')
ax.plot(wmax_2.values, w_max.z, label='0236 UTC', color='tab:orange')
#plt.axvline(max_w2, label=f'Max w in 5-10 km layer {np.round(max_w2, 2)} m/s', linestyle='--', color='tab:orange')
#plt.axvline(mean_w2, label=f'Mean w in 5-10 km layer {np.round(mean_w2, 2)} m/s', linestyle=':', color='tab:orange')
plt.xticks(fontsize=12)
plt.yticks(fontsize=12)
plt.xlabel('$W_{max}$ (m/s)', fontsize=16)
plt.ylabel('Height (km)', fontsize=16)
plt.legend(loc='upper left', fontsize=14)
plt.title('12 November 2018 $w_{max}$ Vertical Profiles', fontsize=18)
ax2 = plt.subplot(122)
ax2.plot(areas1, w_max.z, label='0232 UTC', color='tab:blue')
ax2.plot(areas2, w_max.z, label='0236 UTC', color='tab:orange')
plt.xticks(fontsize=12)
plt.yticks(fontsize=12)
plt.xlabel('$W_{area}$ ($km^2$)', fontsize=16)
plt.ylabel('Height (km)', fontsize=16)
plt.legend(loc='upper left', fontsize=14)
plt.title('12 November 2018 $w_{area}$ Vertical Profiles', fontsize=18)
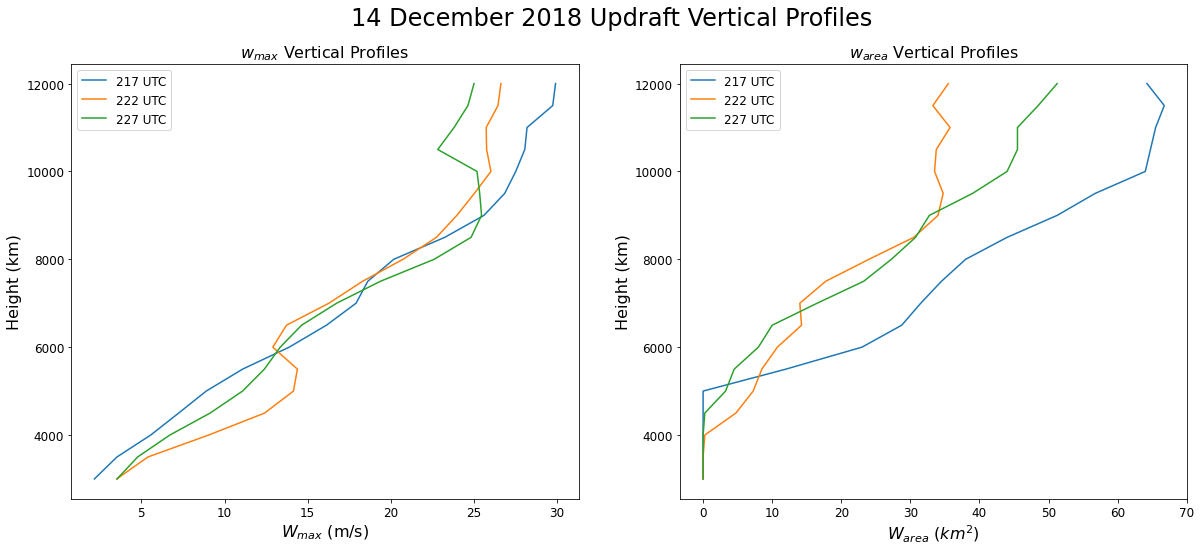
plt.suptitle('12 November 2018 Updraft Vertical Profiles', fontsize=24)
plt.savefig('Vertical_w_prof_12_nov.png', dpi=400)
---------------------------------------------------------------------------
NameError                                 Traceback (most recent call last)
<ipython-input-142-5afd0d603426> in <module>
      7 #plt.axvline(mean_w, label=f'Mean w in 5-10 km layer {np.round(mean_w, 2)} m/s', linestyle=':', color='tab:blue')
      8
----> 9 ax.plot(wmax_2.values, w_max.z, label='0236 UTC', color='tab:orange')
     10 #plt.axvline(max_w2, label=f'Max w in 5-10 km layer {np.round(max_w2, 2)} m/s', linestyle='--', color='tab:orange')
     11 #plt.axvline(mean_w2, label=f'Mean w in 5-10 km layer {np.round(mean_w2, 2)} m/s', linestyle=':', color='tab:orange')

NameError: name 'wmax_2' is not defined
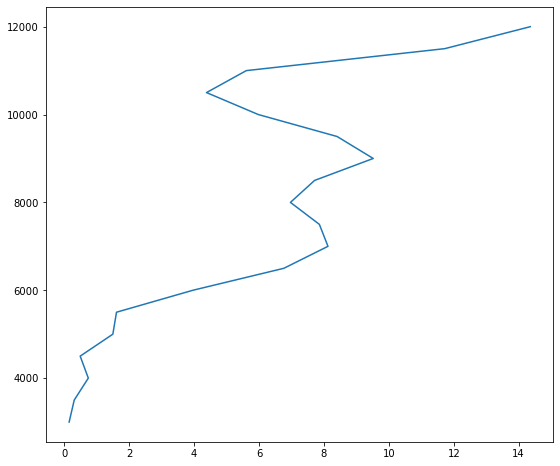
fig = plt.figure(figsize=(12,8))

ax = plt.subplot(111, projection=ccrs.PlateCarree())

cf = plt.pcolormesh(lons, lats,ref , vmin=10, vmax=50, cmap='pyart_Carbone17')
cb1 = plt.colorbar(cf, shrink=.7)
cb1.set_label('Reflectivity (dBZ)', fontsize=16)
cb1.ax.tick_params(labelsize=16)

#q = ax.quiver(lons[::2], lats[::2], u_wnd[::2], v_wnd[::2], pivot='mid', color='black', scale=50, scale_units='inches')

#ax.quiverkey(q, X=.95, Y=.1, U=10, label='10 m/s', labelpos='W')

w_mask = np.nan_to_num(w)
cf = plt.contour(lons, lats, w_mask , levels=[2, 30], colors=['black'], linestyles='dashed')
#plt.colorbar(cf, label='Vertical Velocity (m/s)', shrink=.7)

ot_df.plot(ax=ax, facecolor="none",
              edgecolor='black',linewidth=3, label='otarea')

gl = ax.gridlines(crs=ccrs.PlateCarree(), draw_labels=True,
                  linewidth=2, color='gray', alpha=0.5, linestyle='--')
gl.top_labels = False
gl.left_labels= True
gl.right_labels = False

ax.set_extent((-64.25, -63.8, -31.5, -31.1))

plt.plot(0,0, color='black', label=f'OT Area: {ota[0].round(2)} $km^{2}$ ', linewidth=3)
plt.plot(0,0, color='black', label=f'Updraft Area: {area} $km^{2}$', linewidth=3, linestyle='--')

plt.legend(loc='upper left', fontsize=16)

plt.title('Reflectivity at 1.5 km \n and Mean Updraft 5-10 km \n 12 November 2018 0232 UTC', fontsize=18)

plt.savefig('summary_figs/Nov_12_2018_0230.png', dpi=300)
np.nanpercentile(w, 70)
2.1864180772879176
geo_df = geo_df[(geo_df.minute >= 32) & (geo_df.minute <= 36)]
geo_df['times'] = geo_df.index.strftime('%H%M')
geo_df['times'] = geo_df.times.astype(int)
trop_temps = geo_df.tropopause_temperature.values
trop_height = geo_df.tropopause_height.values

ct_height = geo_df.cloudtop_height.values
ot_temp = geo_df.mintb.values
btd = ot_temp - trop_temps
depth = ct_height - trop_height
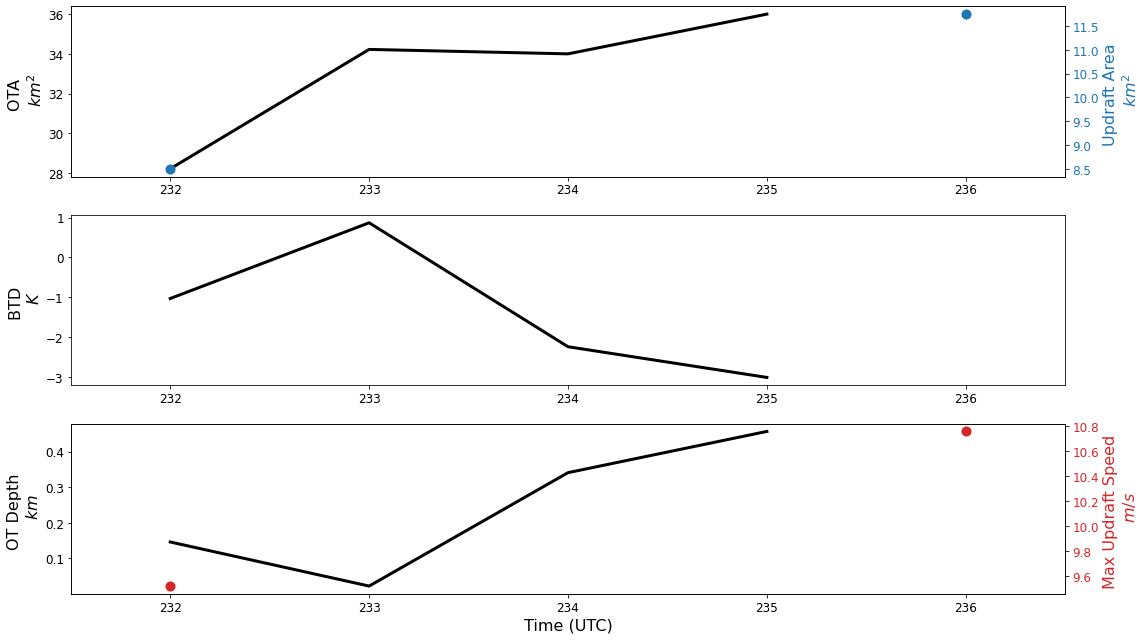
nov12_times = np.array([int(232), int(236)])
nov12_ua = [8.5, 11.75,]
nov12_wmax = [9.52, 10.76]

#nov12_ua = [14.5, 10.75,]
nov12_wmax = [9.52, 10.76]

ticks = np.append(geo_df.times, 236)
plt.figure(figsize=(16,9))
ax = plt.subplot(311)


ota = geo_df.area_circle_polygon
times = geo_df.times

ax.plot(geo_df.times, ota, linewidth=3, color='black')

max_ota = ota.max()

ind = np.where(ota == max_ota)[0][0]

#plt.axhline(ota[ind], linestyle='--', label=f'Max OTA {round(float(max_ota), 2)} $km^{2}$',
#            color='k', linewidth=3)
#ax.scatter(df_sub.datetime, df_sub.area_polygon, s=80, color='black')

plt.yticks(fontsize=12)
plt.xticks(ticks, fontsize=12)

plt.ylabel('OTA \n $km^{2}$', fontsize=16)

ax_1 = plt.twinx()

ax_1.scatter(nov12_times, nov12_ua, linewidth=3, color='tab:blue', linestyle='-', label='Tropopause Height', s=50)
#ax_1.plot(geo_df.times, ota*.4032, linewidth=3, color='tab:blue', linestyle=':')

plt.ylabel('Updraft Area \n $km^{2}$', fontsize=16, color='tab:blue')
plt.xlabel('Time', fontsize=16)

plt.yticks(fontsize=12, color='tab:blue')

plt.yticks(fontsize=12)
plt.xticks(fontsize=12)
plt.xlim(231.5, 236.5)

#plt.legend(loc='lower left', fontsize=16)

ax2 = plt.subplot(312)
ax2.plot(times, btd, linewidth=3, color='black', linestyle='-', label='BTD')
#ax2.plot(times, ot_temp, linewidth=3, color='blue')

plt.yticks(fontsize=12)
plt.xticks(ticks, fontsize=12)

#ax2.scatter(df_sub.datetime, df_sub.mintb, s=80, color='black')

plt.ylabel('BTD \n $K$', fontsize=16)
plt.xlim(231.5, 236.5)

ax3 = plt.subplot(313)
ax3.plot(times, depth, linewidth=3, color='black', linestyle='-', label='Tropopause Height')

#ax3.plot(times, ct_height, linewidth=3, color='red')
#ax3.scatter(df_sub.datetime, df_sub.cloudtop_height.values[0], s=80, color='black')

plt.ylabel('OT Depth \n $km$', fontsize=16)
plt.xlabel('Time (UTC)', fontsize=16)
plt.yticks(fontsize=12)
plt.xticks(ticks, fontsize=12)

ax_3 = ax3.twinx()
ax_3.scatter(nov12_times, nov12_wmax, linewidth=3, color='tab:red', linestyle='-', label='Tropopause Height', s=50)


plt.ylabel('Max Updraft Speed \n $m/s$', fontsize=16, color='tab:red')
plt.xlabel('Time (UTC)', fontsize=16)

plt.yticks(fontsize=12, color='tab:red')
plt.xticks(fontsize=12, color='tab:red')
plt.xlim(231.5, 236.5)


#plt.legend(loc='lower left', fontsize=16)

#ax4 = plt.subplot(514)
#ax4.plot(nov12_times, nov12_ua, linewidth=3, color='tab:blue', linestyle='-', label='Tropopause Height')
#ax3.plot(times, ct_height, linewidth=3, color='red')

#plt.ylabel('Updraft Area \n $km^{2}$', fontsize=16)
#plt.xlabel('Time', fontsize=16)


#ax4 = plt.subplot(515)
#ax4.plot(nov12_times, nov12_wmax, linewidth=3, color='tab:green', linestyle='-', label='Tropopause Height')
#ax3.plot(times, ct_height, linewidth=3, color='red')

#plt.ylabel('Max Updraft Speed \n $m/s$', fontsize=16)
#plt.xlabel('Time', fontsize=16)


#plt.suptitle(f'10 November 2018 Supercell \n {df_sub.datetime.values[0]} UTC', fontsize=24)
    #plt.savefig(f'compare_plots/time_series_{timestamp}.png', dpi=200)

#plt.suptitle()

plt.tight_layout()

plt.savefig('12_November_Time_Series.png', dpi=300)

plt.show()
plt.close()
import numpy as np
len(w[np.where(w > 3)]) * .25
/Users/mgrover/miniconda3/envs/unidata/lib/python3.7/site-packages/ipykernel_launcher.py:2: RuntimeWarning: invalid value encountered in greater
4.5
np.nanpercentile(w, 95)
3.8927460060268086
w_test = ds.where(ds.w >0).sel(z=7000).w.values
np.nanpercentile(w, 90)
3.5118398595380564
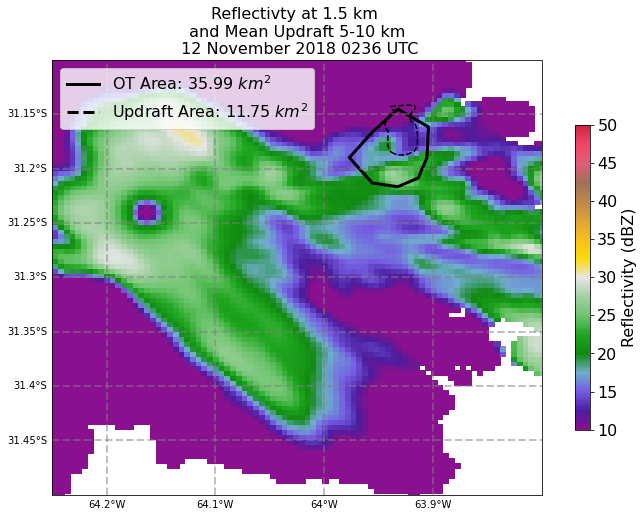
0234 UTC
ds = xr.open_dataset('dual_output/Nov12/man_edited_Nov12_0234.nc').squeeze()
#ds = xr.open_dataset('dual_output/Nov12/new_cleaning/Nov12_0234.nc').squeeze()

df_sub = geo_df[df.minute == 35]
/Users/mgrover/miniconda3/envs/unidata/lib/python3.7/site-packages/geopandas/geodataframe.py:828: UserWarning: Boolean Series key will be reindexed to match DataFrame index.
  result = super(GeoDataFrame, self).__getitem__(key)
ot_df = df_sub[df_sub.lat == df_sub.lat.values[0]]
ota = ot_df.area_circle_polygon.values

ot_df = ot_df.translate(shift_x, shift_y)
lats = ds.lat.values
lons = ds.lon.values

# (ds.lat > -31.2) & (ds.lat < -31.13) & (ds.lon > -64.1) & (ds.lon < -63.95)
w_vals = ds.where((ds.w > 0) & (ds.lat > -31.19) & (ds.lat < -31.14) & (ds.lon > -64.) & (ds.lon < -63.915)).sel(z=slice(3000, 12000)).w
w = ds.where((ds.w > 0) & (ds.lat > -31.19) & (ds.lat < -31.14) & (ds.lon > -64.) & (ds.lon < -63.915)).sel(z=slice(5000, 10000)).w.mean(dim='z').values
w_max = ds.where((ds.w > 0) & (ds.lat > -31.19) & (ds.lat < -31.14) & (ds.lon > -64.) & (ds.lon < -63.915)).sel(z=slice(3000, 12000)).w.max(dim=['x','y'])
ref = ds.sel(z=1500).ZM_composite.values
area = len(w[np.where(w > 2)]) * .25
w_mean = np.nanmean(w[np.where(w > 2)])
/Users/mgrover/miniconda3/envs/unidata/lib/python3.7/site-packages/ipykernel_launcher.py:1: RuntimeWarning: invalid value encountered in greater
  """Entry point for launching an IPython kernel.
/Users/mgrover/miniconda3/envs/unidata/lib/python3.7/site-packages/ipykernel_launcher.py:2: RuntimeWarning: invalid value encountered in greater
print(w_mean)
3.37020812274877
wmax_2 = w_max
areas2, levels = calc_updraft_area(w_vals, 2)
np.nanmax(w_max)
/Users/mgrover/miniconda3/envs/unidata/lib/python3.7/site-packages/ipykernel_launcher.py:15: RuntimeWarning: invalid value encountered in greater
  from ipykernel import kernelapp as app
9.224681331743106
fig = plt.figure(figsize=(12,8))

ax = plt.subplot(111, projection=ccrs.PlateCarree())

cf = plt.pcolormesh(lons, lats,ref , vmin=10, vmax=50, cmap='pyart_Carbone17')
cb1 = plt.colorbar(cf, label='Reflectivity (dBZ)', shrink=.7)
cb1.set_label('Reflectivity (dBZ)', fontsize=16)
cb1.ax.tick_params(labelsize=16)

w_mask = np.nan_to_num(w)
cf = plt.contour(lons, lats, w_mask , levels=[2,30], colors=['black'], linestyles='dashed')
#plt.colorbar(cf, label='Vertical Velocity (m/s)', shrink=.7)

ot_df.plot(ax=ax, facecolor="none",
              edgecolor='black',linewidth=3, label='otarea')

gl = ax.gridlines(crs=ccrs.PlateCarree(), draw_labels=True,
                  linewidth=2, color='gray', alpha=0.5, linestyle='--')
gl.top_labels = False
gl.left_labels= True
gl.right_labels = False

ax.set_extent((-64.25, -63.8, -31.5, -31.1))

plt.plot(0,0, color='black', label=f'OT Area: {ota[0].round(2)} $km^{2}$ ', linewidth=3)
plt.plot(0,0, color='black', label=f'Updraft Area: {area} $km^{2}$', linewidth=3, linestyle='--')

plt.legend(loc='upper left', fontsize=16)
plt.title('Reflectivty at 1.5 km \n and Mean Updraft 5-10 km \n 12 November 2018 0236 UTC', fontsize=16)

plt.savefig('summary_figs/Nov_12_2018_2035.png', dpi=400)
#ds = xr.open_dataset('dual_output/Nov12/man_edited_Nov12_0234.nc').squeeze()
ds = xr.open_dataset('dual_output/Nov12/new_cleaning/Nov12_0230.nc').squeeze()

#df_sub = geo_df[df.minute == 34]
lat_min = -31.3
lat_max = -31.1
lon_min = -64
lon_max = -63.9

lats = ds.lat.values
lons = ds.lon.values

w_vals = ds.where((ds.w > 0) & (ds.lat > lat_min) & (ds.lat < lat_max) & (ds.lon > lon_min) & (ds.lon < lon_max)).sel(z=slice(5000, 10000)).w
w = ds.where((ds.w > 0) & (ds.lat > lat_min) & (ds.lat < lat_max) & (ds.lon > lon_min) & (ds.lon < lon_max)).sel(z=slice(5000, 10000)).w.mean(dim='z').values
w_max = ds.where((ds.w > 0) & (ds.lat > lat_min) & (ds.lat < lat_max) & (ds.lon > lon_min) & (ds.lon < lon_max)).sel(z=slice(5000, 10000)).w.max(dim=['x','y'])
ref = ds.sel(z=3000).ZM_composite.values

area = len(w[np.where(w > 4)]) * .25
areas3, levels = calc_updraft_area(w_vals, 6)
wmax3 = w_max
/Users/mgrover/miniconda3/envs/unidata/lib/python3.7/site-packages/ipykernel_launcher.py:14: RuntimeWarning: invalid value encountered in greater

/Users/mgrover/miniconda3/envs/unidata/lib/python3.7/site-packages/ipykernel_launcher.py:15: RuntimeWarning: invalid value encountered in greater
  from ipykernel import kernelapp as app
np.nanpercentile(w, 70)
2.537108953669664
fig = plt.figure(figsize=(12,8))
ax = plt.subplot(111, projection=ccrs.PlateCarree())
cf = plt.contourf(lons, lats,ref , np.arange(-20, 60, 4), cmap='pyart_HomeyerRainbow')
cb1 = plt.colorbar(cf, shrink=.7)
cb1.set_label('Reflectivity (dBZ)', fontsize=16)
cb1.ax.tick_params(labelsize=16)
#q = ax.quiver(lons[::2], lats[::2], u_wnd[::2], v_wnd[::2], pivot='mid', color='black', scale=50, scale_units='inches')
#ax.quiverkey(q, X=.95, Y=.1, U=10, label='10 m/s', labelpos='W')
w_mask = np.nan_to_num(w)
cf = plt.contour(lons, lats, w_mask , levels=[2,4, 30], colors=['black'], linestyles='dashed')
#plt.colorbar(cf, label='Vertical Velocity (m/s)', shrink=.7)
ot_df.plot(ax=ax, facecolor="none",
edgecolor='black',linewidth=3, label='otarea')
gl = ax.gridlines(crs=ccrs.PlateCarree(), draw_labels=True,
linewidth=2, color='gray', alpha=0.5, linestyle='--')
gl.top_labels = False
gl.left_labels= True
gl.right_labels = False
ax.set_extent((-64.25, -63.65, -31.5, -31.))
#plt.plot(0,0, color='black', label=f'OT Area: {ota[0].round(2)} $km^{2}$ ', linewidth=3)
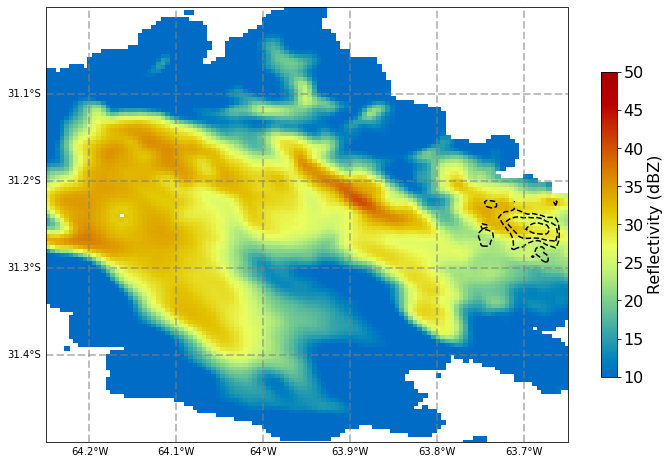
plt.plot(0,0, color='black', label=f'Updraft Area: {area} $km^{2}$', linewidth=3, linestyle='--')
plt.legend(loc='upper left', fontsize=16)
plt.title('Reflectivity at 1.5 km \n and Mean Updraft 5-10 km \n 12 November 2018 0226 UTC', fontsize=18)
Text(0.5, 1.0, 'Reflectivity at 1.5 km \n and Mean Updraft 5-10 km \n 12 November 2018 0226 UTC')
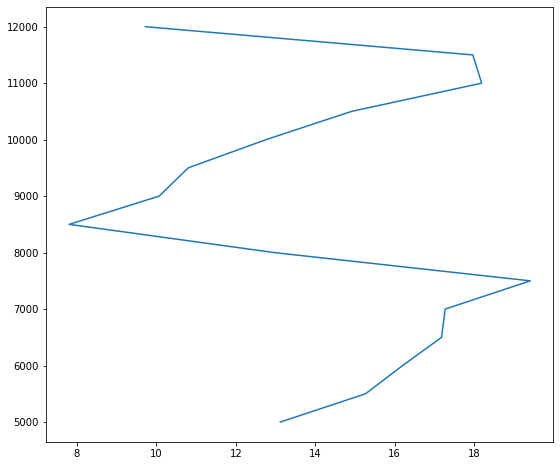
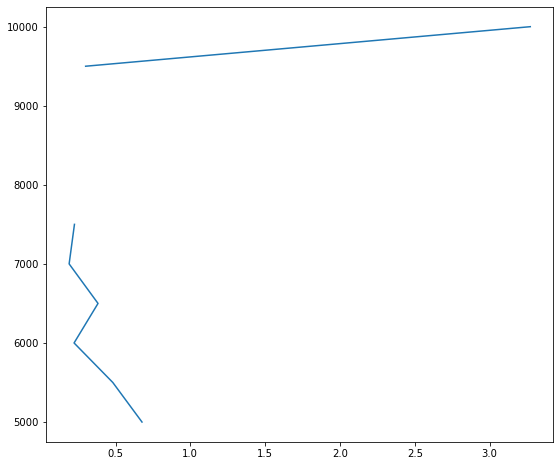
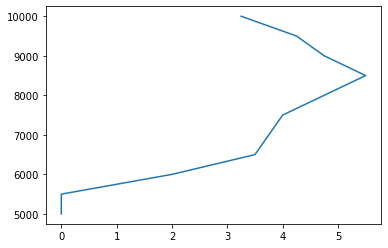
plt.plot(areas3, levels)
[<matplotlib.lines.Line2D at 0x7fb8eb350cd0>]
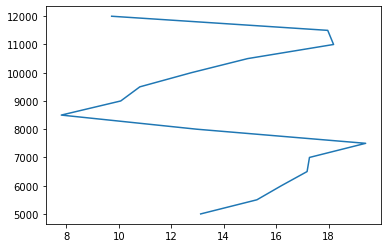
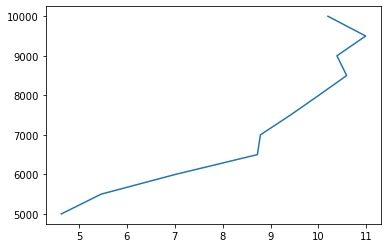
plt.plot(wmax3, levels)
[<matplotlib.lines.Line2D at 0x7fb8eb3e9990>]
ds = xr.open_dataset('dual_output/Nov12/Nov12_0240.nc').squeeze()

df_sub = geo_df[df.minute == 41]

ot_df = df_sub[df_sub.lat == df_sub.lat.values[0]]
/Users/mgrover/miniconda3/envs/unidata/lib/python3.7/site-packages/geopandas/geodataframe.py:828: UserWarning: Boolean Series key will be reindexed to match DataFrame index.
  result = super(GeoDataFrame, self).__getitem__(key)
---------------------------------------------------------------------------
IndexError                                Traceback (most recent call last)
<ipython-input-65-c26701b878ed> in <module>
      3 df_sub = geo_df[df.minute == 41]
      4
----> 5 ot_df = df_sub[df_sub.lat == df_sub.lat.values[0]]

IndexError: index 0 is out of bounds for axis 0 with size 0
ota = ot_df.area_circle_polygon.values

ot_lon = df_sub.lon.values[0]
ot_lat = df_sub.lat.values[0]

shift_x = ot_df.lon_corr.values[0] - ot_lon
shift_y = ot_df.lat_corr.values[0] - ot_lat

ot_df = ot_df.translate(shift_x, shift_y)
---------------------------------------------------------------------------
AttributeError                            Traceback (most recent call last)
<ipython-input-162-b52f368987db> in <module>
----> 1 ota = ot_df.area_circle_polygon.values
      2
      3 ot_lon = df_sub.lon.values[0]
      4 ot_lat = df_sub.lat.values[0]
      5

~/miniconda3/envs/unidata/lib/python3.7/site-packages/pandas/core/generic.py in __getattr__(self, name)
   5128             if self._info_axis._can_hold_identifiers_and_holds_name(name):
   5129                 return self[name]
-> 5130             return object.__getattribute__(self, name)
   5131
   5132     def __setattr__(self, name: str, value) -> None:

AttributeError: 'GeoSeries' object has no attribute 'area_circle_polygon'
lats = ds.lat.values
lons = ds.lon.values

# (ds.lat > -31.2) & (ds.lat < -31.13) & (ds.lon > -64.1) & (ds.lon < -63.95)
w = ds.where((ds.w > 0)).sel(z=slice(6000, 10000)).w.mean(dim='z').values

ref = ds.sel(z=1500).ZM_composite.values

ua = len(w[np.where(w > 2)]) * .25
/Users/mgrover/miniconda3/envs/unidata/lib/python3.7/site-packages/xarray/core/nanops.py:142: RuntimeWarning: Mean of empty slice
  return np.nanmean(a, axis=axis, dtype=dtype)
/Users/mgrover/miniconda3/envs/unidata/lib/python3.7/site-packages/ipykernel_launcher.py:9: RuntimeWarning: invalid value encountered in greater
  if __name__ == '__main__':
fig = plt.figure(figsize=(12,8))

ax = plt.subplot(111, projection=ccrs.PlateCarree())

cf = plt.contourf(lons, lats,ref , np.arange(-20, 60, 4), cmap='pyart_HomeyerRainbow')
plt.colorbar(cf, label='Reflectivity (dBZ)', shrink=.7)

cf = plt.contourf(lons, lats,w , np.arange(2, 10, 0.5), cmap='magma')
plt.colorbar(cf, label='Vertical Velocity (m/s)', shrink=.7)

ot_df.plot(ax=ax, facecolor="none",
              edgecolor='black',linewidth=3, label='otarea')

gl = ax.gridlines(crs=ccrs.PlateCarree(), draw_labels=True,
                  linewidth=2, color='gray', alpha=0.5, linestyle='--')
gl.top_labels = False
gl.left_labels= True
gl.right_labels = False

ax.set_extent((-64.25, -63.8, -31.5, -31.1))

plt.plot(0,0, color='black', label=f'OT Area: {ota[0].round(2)} $km^{2}$ \n Updraft Area: {ua} $km^{2}$', linewidth=3)

plt.legend(loc='upper right')

plt.title('Reflectivty at 1.5 km \n and Mean Updraft 5-10 km \n 12 November 2018 0242 UTC', fontsize=16)

#plt.savefig('summary_figs/Nov_12_2018_2034.png', dpi=400)
Text(0.5, 1.0, 'Reflectivty at 1.5 km \n and Mean Updraft 5-10 km \n 12 November 2018 0242 UTC')
10 November 2018 Case
def plot_ot(ot_df_path, dda_ds_path, minute, minlat, maxlat, minlon, maxlon, time='2012', ot_index_val=0,):

    # Read in the dataframe
    df = pd.read_csv(ot_df_path, index_col='time', parse_dates=True)

    # Read in DDA dataset
    ds = xr.open_dataset(dda_ds_path).squeeze()

    # Assign minutes
    df['minute'] = df.index.minute

    # Convert geometry
    df['geometry'] = df['geometry'].apply(wkt.loads)
    geo_df = gpd.GeoDataFrame(df, geometry='geometry')

    # Subset minute
    df_sub = geo_df[df.minute == minute]

    # Read in index val
    ot_df = df_sub[df_sub.lat == df_sub.lat.values[ot_index_val]]

    # Extract OTA
    ota = ot_df.area_circle_polygon.values

    # Extract Centroid location
    ot_lon = ot_df.centroid.x.values[0]
    ot_lat = ot_df.centroid.y.values[0]

    # Shift over OT
    shift_x = ot_df.lon.values[0] - ot_lon
    shift_y = ot_df.lat.values[0] - ot_lat
    ot_df = ot_df.translate(shift_x, shift_y)

    # Extract lat and lon values
    lats = ds.lat.values
    lons = ds.lon.values

    # Extract updraft velocities
    ds_w = ds.where((ds.w > 0) & (ds.lat > minlat) & (ds.lat < maxlon) & (ds.lon > minlon) & (ds.lon < maxlon)).sel(z=slice(3000, 10000)).w.mean(dim='z').values

    ref = ds.sel(z=1500).ZM_composite.values

    w = ds_w

    count = len(w[np.where(w > 8)])

    updraft_area = count * .25

    fig = plt.figure(figsize=(12,8))

    ax = plt.subplot(111, projection=ccrs.PlateCarree())

    cf = plt.contourf(lons, lats,ref , np.arange(-20, 60, 4), cmap='pyart_HomeyerRainbow')
    plt.colorbar(cf, label='Reflectivity (dBZ)', shrink=.7)

    cf = plt.contourf(lons, lats, w , np.arange(8, 20, 0.5), cmap='magma')
    plt.colorbar(cf, label='Vertical Velocity (m/s)', shrink=.7)

    ot_df.plot(ax=ax, facecolor="none",
              edgecolor='red',linewidth=3, label='otarea')

    gl = ax.gridlines(crs=ccrs.PlateCarree(), draw_labels=True,
                      linewidth=2, color='gray', alpha=0.5, linestyle='--')
    gl.top_labels = False
    gl.left_labels= True
    gl.right_labels = False

    ax.set_extent((-64.3, -63.9, -32.2, -31.9))

    plt.plot(0,0, color='red', label=f'OT Area: {ota[0].round(2)} km2 \n Updraft Area: 11 km2', linewidth=3)

    plt.legend(loc='upper right')

    plt.title('Reflectivty at 1.5 km \n and Mean Updraft 3-10 km \n 10 November 2018 2012 UTC', fontsize=16)

    plt.savefig('summary_figs/Nov_10_2018_2012.png', dpi=400)
df = pd.read_csv('ot_output/Revised_OTs_10_Nov_2007_2024.csv', index_col='time', parse_dates=True)
df['mean_rad'] = np.mean(df[['e_radial', 'se_radial', 's_radial', 'sw_radial', 'w_radial', 'nw_radial', 'n_radial', 'ne_radial']].values * 2, 1)
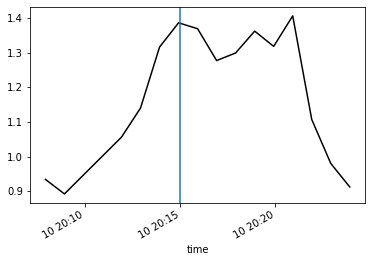
df['ot_depth'] = df.cloudtop_height - df.tropopause_height
from datetime import datetime
df.ot_depth.plot(color='black')
#df.mintb.plot(color='blue')

plt.axvline(datetime(2018, 11, 10, 20, 15))
<matplotlib.lines.Line2D at 0x7fdaf69b15d0>
df['ot_depth'] = df.cloudtop_height - df.tropopause_height
df[['area_circle_polygon', 'ot_depth', 'mintb']]
| area_circle_polygon | ot_depth | mintb | |
|---|---|---|---|
| time | |||
| 2018-11-10 20:07:55.000000512 | 76.837805 | 0.934000 | 195.819992 |
| 2018-11-10 20:08:55.000000512 | 108.972626 | 0.892000 | 196.080002 |
| 2018-11-10 20:11:55.000000512 | 111.806680 | 1.056000 | 195.089996 |
| 2018-11-10 20:12:55.000000512 | 110.269330 | 1.139999 | 194.509995 |
| 2018-11-10 20:13:55.000000512 | 121.941273 | 1.316000 | 193.399994 |
| 2018-11-10 20:14:55.000000512 | 108.745111 | 1.386000 | 192.889999 |
| 2018-11-10 20:15:55.000000512 | 95.532540 | 1.369001 | 192.989990 |
| 2018-11-10 20:16:55.000000512 | 86.517142 | 1.277000 | 193.610001 |
| 2018-11-10 20:17:55.000000512 | 68.686139 | 1.299000 | 193.470001 |
| 2018-11-10 20:18:55.000000512 | 55.039897 | 1.362000 | 193.000000 |
| 2018-11-10 20:19:55.000000512 | 50.192336 | 1.318001 | 193.339996 |
| 2018-11-10 20:20:55.000000512 | 39.628697 | 1.406000 | 192.720001 |
| 2018-11-10 20:21:55.000000512 | 42.935395 | 1.107000 | 194.639999 |
| 2018-11-10 20:22:55.000000512 | 36.549424 | 0.980001 | 195.449997 |
| 2018-11-10 20:23:55.000000512 | 35.895178 | 0.912001 | 195.849991 |
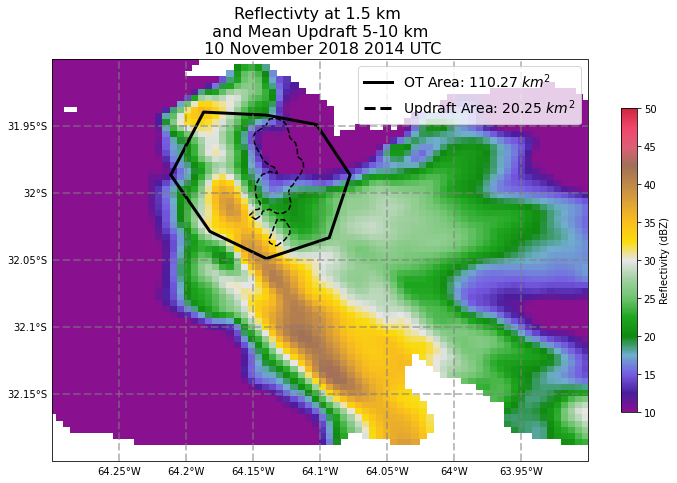
ds = xr.open_dataset('dual_output/Nov10/2014.nc').squeeze()
df['minute'] = df.index.minute + 1
from shapely import wkt

df['geometry'] = df['geometry'].apply(wkt.loads)
geo_df = gpd.GeoDataFrame(df, geometry='geometry')
df_sub = geo_df[df.minute == 13]
ot_df = df_sub[df_sub.lat == df_sub.lat.values[0]]
ota = ot_df.area_circle_polygon.values
ot_lon = ot_df.centroid.x.values[0]
ot_lat = ot_df.centroid.y.values[0]

shift_x = ot_df.lon_corr.values[0] - ot_lon
shift_y = ot_df.lat_corr.values[0] - ot_lat

ot_df = ot_df.translate(shift_x, shift_y)
lats = ds.lat.values
lons = ds.lon.values
w_vals = ds.where((ds.w > 0) & (ds.lat < -31.94) & (ds.lat > -32.05) & (ds.lon < -64.1)).sel(z=slice(3000, 12000)).w
ds_w = ds.where((ds.w > 0) & (ds.lat < -31.94) & (ds.lat > -32.05) & (ds.lon < -64.1)).sel(z=slice(5000, 10000)).w.mean(dim='z').values
ds_wmax = ds.where((ds.w > 0) & (ds.lat < -31.94) & (ds.lat > -32.05) & (ds.lon < -64.1)).sel(z=slice(3000, 12000)).w.max(dim=['x', 'y'])
ref = ds.sel(z=1500).ZM_composite.values
w_max_list = []


w_max_list.append(ds_wmax)

w_area_list = []
areas, levels = calc_updraft_area(w_vals, 4)
w_area_list.append(xr.DataArray(areas, coords={'z':levels,
                  'time':ds_wmax.time}, dims={'z':levels}))
/Users/mgrover/miniconda3/envs/unidata/lib/python3.7/site-packages/ipykernel_launcher.py:15: RuntimeWarning: invalid value encountered in greater
  from ipykernel import kernelapp as app
w = ds_w
np.nanmax(ds_wmax)
24.65440187145197
count = len(w[np.where(w > 4)]) * .25
w_mean = np.nanmean(w[np.where(w > 4)])
/Users/mgrover/miniconda3/envs/unidata/lib/python3.7/site-packages/ipykernel_launcher.py:1: RuntimeWarning: invalid value encountered in greater
  """Entry point for launching an IPython kernel.
/Users/mgrover/miniconda3/envs/unidata/lib/python3.7/site-packages/ipykernel_launcher.py:2: RuntimeWarning: invalid value encountered in greater
w_mean
7.106634866081917
fig = plt.figure(figsize=(12,8))

ax = plt.subplot(111, projection=ccrs.PlateCarree())

cf = plt.pcolormesh(lons, lats,ref , vmin=10, vmax=50, cmap='pyart_Carbone17')
plt.colorbar(cf, label='Reflectivity (dBZ)', shrink=.7)

w_mask = np.nan_to_num(w)
cf = plt.contour(lons, lats, w_mask , levels=[4, 30], colors=['black'], linestyles='dashed')
#plt.colorbar(cf, label='Vertical Velocity (m/s)', shrink=.7)

ot_df.plot(ax=ax, facecolor="none",
              edgecolor='black',linewidth=3, label='otarea')

gl = ax.gridlines(crs=ccrs.PlateCarree(), draw_labels=True,
                  linewidth=2, color='gray', alpha=0.5, linestyle='--')
gl.top_labels = False
gl.left_labels= True
gl.right_labels = False

ax.set_extent((-64.3, -63.9, -32.2, -31.9))

plt.plot(0,0, color='black', label=f'OT Area: {ota[0].round(2)} $km^{2}$ ', linewidth=3)
plt.plot(0,0, color='black', label=f'Updraft Area: {count} $km^{2}$', linewidth=3, linestyle='--')

plt.legend(loc='upper right', fontsize=14)

plt.title('Reflectivty at 1.5 km \n and Mean Updraft 5-10 km \n 10 November 2018 2014 UTC', fontsize=16)

plt.savefig('summary_figs/Nov_10_2018_2014.png', dpi=400)
10 November 2018 2007 UTC
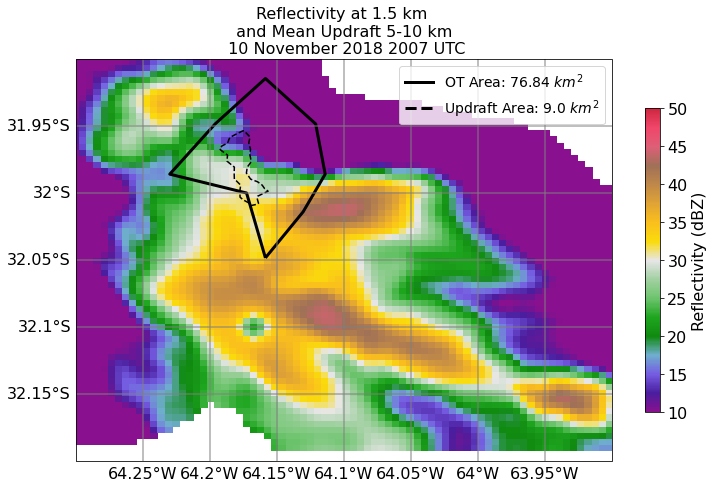
ds = xr.open_dataset('dual_output/Nov10/2007.nc').squeeze()

ot_df = geo_df[df.minute == 8]

ota = ot_df.area_circle_polygon.values

ot_lon = ot_df.centroid.x.values[0]
ot_lat = ot_df.centroid.y.values[0]

shift_x = ot_df.lon_corr.values[0] - ot_lon
shift_y = ot_df.lat_corr.values[0] - ot_lat

ot_df = ot_df.translate(shift_x, shift_y)

lats = ds.lat.values
lons = ds.lon.values

w_vals = ds.where((ds.w > 0) & ((ds.lon > -64.2) & (ds.lon < -64.1) & (ds.lat >-32.02)& (ds.lat < -31.95))).sel(z=slice(3000, 12000)).w
ds_w = ds.where((ds.w > 0) & ((ds.lon > -64.2) & (ds.lon < -64.1) & (ds.lat >-32.02)& (ds.lat < -31.95))).sel(z=slice(5000, 10000)).w.mean(dim='z').values
ds_wmax = ds.where((ds.w > 0) & (ds.lat > -32.05) & (ds.lon < -64.1)).sel(z=slice(3000, 12000)).w.max(dim=['x','y'])
w_max_list.append(ds_wmax)

areas, levels = calc_updraft_area(w_vals, 4)
w_area_list.append(xr.DataArray(areas, coords={'z':levels,
                  'time':ds_wmax.time}, dims={'z':levels}))

ref = ds.sel(z=1500).ZM_composite.values

print('Max Vel: ', np.nanmax(ds_wmax))
Max Vel: 20.043541295937167
/Users/mgrover/miniconda3/envs/unidata/lib/python3.7/site-packages/ipykernel_launcher.py:15: RuntimeWarning: invalid value encountered in greater
  from ipykernel import kernelapp as app
ds_wmax.assign_attrs(updraft_area=[0, 1])
<xarray.DataArray 'w' (z: 19)>
array([ 7.44312289,  6.85908383,  6.86061985,  5.5285899 ,  5.97692763,
        5.67946986,  6.54481647,  9.12689833,  9.48607372, 10.27962929,
       10.12974101, 11.82803872, 11.69841943, 12.78977562, 13.63978675,
       18.3498372 , 20.0435413 , 16.32938832,  2.91017584])
Coordinates:
    time     datetime64[ns] 2018-11-10T20:06:19.075000
  * z        (z) float64 3e+03 3.5e+03 4e+03 ... 1.1e+04 1.15e+04 1.2e+04
Attributes:
    updraft_area:  [0, 1]
xarray.DataArray
'w'
- z: 19
- 7.443 6.859 6.861 5.529 5.977 5.679 ... 13.64 18.35 20.04 16.33 2.91
array([ 7.44312289, 6.85908383, 6.86061985, 5.5285899 , 5.97692763, 5.67946986, 6.54481647, 9.12689833, 9.48607372, 10.27962929, 10.12974101, 11.82803872, 11.69841943, 12.78977562, 13.63978675, 18.3498372 , 20.0435413 , 16.32938832, 2.91017584]) - time()datetime64[ns]2018-11-10T20:06:19.075000
array('2018-11-10T20:06:19.075000000', dtype='datetime64[ns]') - z(z)float643e+03 3.5e+03 ... 1.15e+04 1.2e+04
- standard_name :
- projection_z_coordinate
- long_name :
- Z distance on the projection plane from the origin
- axis :
- Z
- units :
- m
- positive :
- up
array([ 3000.,  3500.,  4000.,  4500.,  5000.,  5500.,  6000.,  6500.,  7000.,
        7500.,  8000.,  8500.,  9000.,  9500., 10000., 10500., 11000., 11500.,
       12000.])
- updraft_area :
- [0, 1]
areas
array([ 2.5 ,  1.75,  1.75,  0.  ,  0.75,  0.5 ,  1.  ,  2.  ,  1.75,
        3.5 ,  5.5 , 11.25, 10.  ,  9.  ,  8.25,  6.  ,  3.5 ,  1.25,
        0.  ])
w = ds_w
count = len(w[np.where(w > 4)]) * .25
w_mean = np.nanmean(w[np.where(w > 4)])

fig = plt.figure(figsize=(12,8))

ax = plt.subplot(111, projection=ccrs.PlateCarree())

cf = plt.pcolormesh(lons, lats,ref , vmin=10, vmax=50, cmap='pyart_Carbone17')
cb1 = plt.colorbar(cf, shrink=.7)
cb1.set_label('Reflectivity (dBZ)', fontsize=16)
cb1.ax.tick_params(labelsize=16)

#q = ax.quiver(lons[::2], lats[::2], u_wnd[::2], v_wnd[::2], pivot='mid', color='black', scale=50, scale_units='inches')

#ax.quiverkey(q, X=.95, Y=.1, U=10, label='10 m/s', labelpos='W')

w_mask = np.nan_to_num(w)
cf = plt.contour(lons, lats, w_mask , levels=[4, 40], colors=['black'], linestyles='dashed')
#cb = plt.colorbar(cf, shrink=.7)
#cb.set_label('Vertical Velocity (m/s)', fontsize=16)
cb1.ax.tick_params(labelsize=16)

ot_df.plot(ax=ax, facecolor="none",
              edgecolor='black',linewidth=3, label='otarea')

gl = ax.gridlines(crs=ccrs.PlateCarree(), draw_labels=True,
                  linewidth=2, color='gray', alpha=0.5, linestyles='solid')
gl.top_labels = False
gl.left_labels= True
gl.right_labels = False
gl.xlabel_style = {'size': 16, 'color': 'k'}
gl.ylabel_style = {'size': 16, 'color': 'k'}

ax.set_extent((-64.3, -63.9, -32.2, -31.9))

plt.plot(0,0, color='black', label=f'OT Area: {ota[0].round(2)} $km^{2}$ ', linewidth=3)
plt.plot(0,0, color='black', label=f'Updraft Area: {count} $km^{2}$', linewidth=3, linestyle='--')

plt.legend(loc='upper right', fontsize=14)

plt.title('Reflectivity at 1.5 km \n and Mean Updraft 5-10 km \n 10 November 2018 2007 UTC', fontsize=16)

plt.savefig('summary_figs/Nov_10_2018_2007.png', dpi=400)
/Users/mgrover/miniconda3/envs/unidata/lib/python3.7/site-packages/ipykernel_launcher.py:2: RuntimeWarning: invalid value encountered in greater

/Users/mgrover/miniconda3/envs/unidata/lib/python3.7/site-packages/ipykernel_launcher.py:3: RuntimeWarning: invalid value encountered in greater
  This is separate from the ipykernel package so we can avoid doing imports until
10 November 2018 2012 UTC
ds = xr.open_dataset('dual_output/Nov10/2012.nc').squeeze()
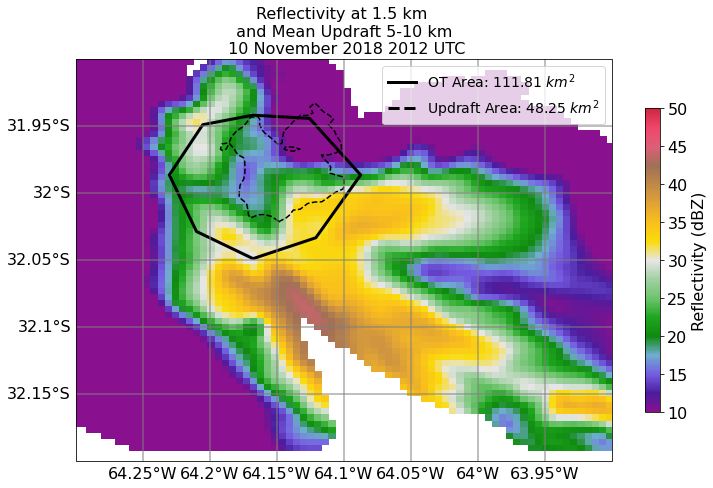
ot_df = geo_df[geo_df.minute == 12]
ot_df.area_circle_polygon.values[0]
111.80667965395409
df_sub = geo_df[df.minute == 12]
ot_df = df_sub[df_sub.lat == df_sub.lat.values[0]]
ota = ot_df.area_circle_polygon.values
ot_lon = ot_df.centroid.x.values[0]
ot_lat = ot_df.centroid.y.values[0]

shift_x = ot_df.lon_corr.values[0] - ot_lon
shift_y = ot_df.lat_corr.values[0] - ot_lat

ot_df = ot_df.translate(shift_x, shift_y)
fig = plt.figure(figsize=(12,8))
ax = plt.subplot(111, projection=ccrs.PlateCarree())
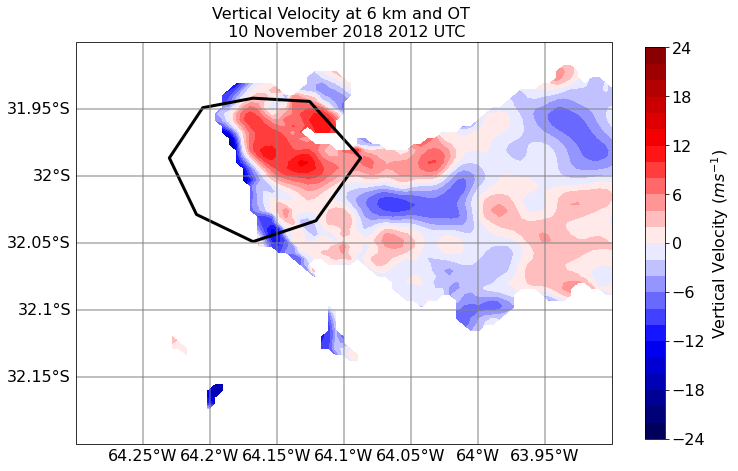
ds_w = ds.where((ds.w > 0) & (ds.lon < -64.1) & (ds.lat >-32.03)).sel(z=slice(5000, 10000)).w.mean(dim='z').values
w = ds.sel(z=6000).w.values
lons = ds.lon.values
lats = ds.lat.values
lons, lats = np.meshgrid(lons, lats)
#c = plt.contour(lons, lats, w, levels=np.arange(4, 26,20), cmap='seismic')
cf = plt.contourf(lons, lats, w, levels=np.arange(-24, 26,2), cmap='seismic')
cb1 = plt.colorbar(cf, shrink=.9)
cb1.set_label('Vertical Velocity ($ms^{-1}$)', fontsize=16)
cb1.ax.tick_params(labelsize=16)
#q = ax.quiver(lons[::2], lats[::2], u_wnd[::2], v_wnd[::2], pivot='mid', color='black', scale=50, scale_units='inches')
#ax.quiverkey(q, X=.95, Y=.1, U=10, label='10 m/s', labelpos='W')
ot_df.plot(ax=ax, facecolor="none",
edgecolor='black',linewidth=3, label='otarea')
gl = ax.gridlines(crs=ccrs.PlateCarree(), draw_labels=True,
linewidth=2, color='gray', alpha=0.5, linestyles='solid')
gl.top_labels = False
gl.left_labels= True
gl.right_labels = False
gl.xlabel_style = {'size': 16, 'color': 'k'}
gl.ylabel_style = {'size': 16, 'color': 'k'}
ax.set_extent((-64.3, -63.9, -32.2, -31.9))
#plt.plot(0,0, color='black', label=f'OT Area: {ota[0].round(2)} $km^{2}$ ', linewidth=3)
#plt.legend(loc='upper right', fontsize=14)
plt.title('Vertical Velocity at 6 km and OT \n 10 November 2018 2012 UTC', fontsize=16)
plt.savefig('summary_figs/Nov_10_2018_2012_w.png', dpi=400)
ds.sel(z=6000).w.plot.contourf(x='lon', y='lat', levels=np.arange(-24, 24, 2))
---------------------------------------------------------------------------
ValueError                                Traceback (most recent call last)
<ipython-input-44-d73908664689> in <module>
----> 1 ds.sel(z=6000).w.plot.contourf(x='lon', y='lat', levels=np.arange(-24, 24, 2))

~/miniconda3/envs/unidata/lib/python3.7/site-packages/xarray/plot/plot.py in plotmethod(_PlotMethods_obj, x, y, figsize, size, aspect, ax, row, col, col_wrap, xincrease, yincrease, add_colorbar, add_labels, vmin, vmax, cmap, colors, center, robust, extend, levels, infer_intervals, subplot_kws, cbar_ax, cbar_kwargs, xscale, yscale, xticks, yticks, xlim, ylim, norm, **kwargs)
    842         for arg in ["_PlotMethods_obj", "newplotfunc", "kwargs"]:
    843             del allargs[arg]
--> 844         return newplotfunc(**allargs)
    845
    846     # Add to class _PlotMethods

~/miniconda3/envs/unidata/lib/python3.7/site-packages/xarray/plot/plot.py in newplotfunc(darray, x, y, figsize, size, aspect, ax, row, col, col_wrap, xincrease, yincrease, add_colorbar, add_labels, vmin, vmax, cmap, center, robust, extend, levels, infer_intervals, colors, subplot_kws, cbar_ax, cbar_kwargs, xscale, yscale, xticks, yticks, xlim, ylim, norm, **kwargs)
    669
    670         xlab, ylab = _infer_xy_labels(
--> 671             darray=darray, x=x, y=y, imshow=imshow_rgb, rgb=rgb
    672         )
    673

~/miniconda3/envs/unidata/lib/python3.7/site-packages/xarray/plot/utils.py in _infer_xy_labels(darray, x, y, imshow, rgb)
    384         y = darray.dims[0] if x == darray.dims[1] else darray.dims[1]
    385     else:
--> 386         _assert_valid_xy(darray, x, "x")
    387         _assert_valid_xy(darray, y, "y")
    388

~/miniconda3/envs/unidata/lib/python3.7/site-packages/xarray/plot/utils.py in _assert_valid_xy(darray, xy, name)
    410     if xy not in valid_xy:
    411         valid_xy_str = "', '".join(sorted(valid_xy))
--> 412         raise ValueError(f"{name} must be one of None, '{valid_xy_str}'")
    413
    414

ValueError: x must be one of None, 'time', 'x', 'y', 'z'
ot_df = geo_df[df.minute == 12]
ota = ot_df.area_circle_polygon.values
ot_lon = ot_df.centroid.x.values[0]
ot_lat = ot_df.centroid.y.values[0]
shift_x = ot_df.lon_corr.values[0] - ot_lon
shift_y = ot_df.lat_corr.values[0] - ot_lat
ot_df = ot_df.translate(shift_x, shift_y)
lats = ds.lat.values
lons = ds.lon.values
w_vals = ds.where((ds.w > 0) & (ds.lon < -64.1) & (ds.lat >-32.03)).sel(z=slice(3000, 12000)).w
ds_w = ds.where((ds.w > 0) & (ds.lon < -64.1) & (ds.lat >-32.03)).sel(z=slice(5000, 10000)).w.mean(dim='z').values
ds_wmax = ds.where((ds.w > 0) & (ds.lat > -32.05) & (ds.lon < -64.1)).sel(z=slice(3000, 12000)).w.max(dim=['x','y'])
ref = ds.sel(z=1500).ZM_composite.values
w_max_list.append(ds_wmax)

areas, levels = calc_updraft_area(w_vals, 4)
w_area_list.append(xr.DataArray(areas, coords={'z':levels,
                  'time':ds_wmax.time}, dims={'z':levels}))
np.nanmax(ds_wmax)
/Users/mgrover/miniconda3/envs/unidata/lib/python3.7/site-packages/ipykernel_launcher.py:15: RuntimeWarning: invalid value encountered in greater
  from ipykernel import kernelapp as app
25.525771181621675
w = ds_w
count = len(w[np.where(w > 4)]) * .25
w_mean = np.nanmean(w[np.where(w > 4)])
/Users/mgrover/miniconda3/envs/unidata/lib/python3.7/site-packages/ipykernel_launcher.py:1: RuntimeWarning: invalid value encountered in greater
  """Entry point for launching an IPython kernel.
/Users/mgrover/miniconda3/envs/unidata/lib/python3.7/site-packages/ipykernel_launcher.py:2: RuntimeWarning: invalid value encountered in greater
ota
array([111.80667965])
fig = plt.figure(figsize=(12,8))

ax = plt.subplot(111, projection=ccrs.PlateCarree())

cf = plt.pcolormesh(lons, lats,ref , vmin=10, vmax=50, cmap='pyart_Carbone17')
cb1 = plt.colorbar(cf, shrink=.7)
cb1.set_label('Reflectivity (dBZ)', fontsize=16)
cb1.ax.tick_params(labelsize=16)

#q = ax.quiver(lons[::2], lats[::2], u_wnd[::2], v_wnd[::2], pivot='mid', color='black', scale=50, scale_units='inches')

#ax.quiverkey(q, X=.95, Y=.1, U=10, label='10 m/s', labelpos='W')

w_mask = np.nan_to_num(w)
cf = plt.contour(lons, lats, w_mask , levels=[4,40], colors=['black'], linestyles='dashed')
#cb = plt.colorbar(cf, shrink=.7)
#cb.set_label('Vertical Velocity (m/s)', fontsize=16)
cb1.ax.tick_params(labelsize=16)

ot_df.plot(ax=ax, facecolor="none",
              edgecolor='black',linewidth=3, label='otarea')

gl = ax.gridlines(crs=ccrs.PlateCarree(), draw_labels=True,
                  linewidth=2, color='gray', alpha=0.5, linestyles='solid')
gl.top_labels = False
gl.left_labels= True
gl.right_labels = False
gl.xlabel_style = {'size': 16, 'color': 'k'}
gl.ylabel_style = {'size': 16, 'color': 'k'}

ax.set_extent((-64.3, -63.9, -32.2, -31.9))

plt.plot(0,0, color='black', label=f'OT Area: {ota[0].round(2)} $km^{2}$ ', linewidth=3)
plt.plot(0,0, color='black', label=f'Updraft Area: {count} $km^{2}$', linewidth=3, linestyle='--')

plt.legend(loc='upper right', fontsize=14)

plt.title('Reflectivity at 1.5 km \n and Mean Updraft 5-10 km \n 10 November 2018 2012 UTC', fontsize=16)

plt.savefig('summary_figs/Nov_10_2018_2012.png', dpi=400)
ds_w = ds.where((ds.w > 4) & (ds.lon < -64.1)).sel(z=6000).w.values
w = ds_w[np.where(ds_w > 8)]
rho = .4
a = len(w) * 500 * 500
mass_f = rho * w
/Users/mgrover/miniconda3/envs/unidata/lib/python3.7/site-packages/ipykernel_launcher.py:1: RuntimeWarning: invalid value encountered in greater
  """Entry point for launching an IPython kernel.
len(w) * .25
18.25
np.sum(w) * len(w)* (.25)
13127.455826883453
(np.sum(mass_f) * a)/1e2
52509823.307533816
10 November 2018 2020 UTC
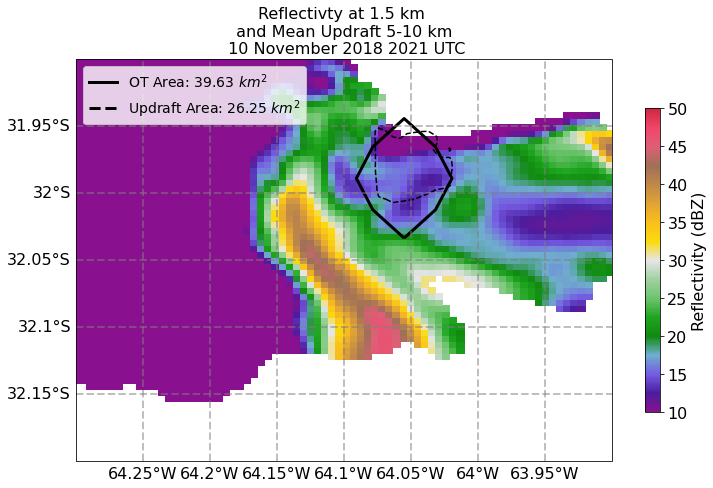
ds = xr.open_dataset('dual_output/Nov10/2021.nc').squeeze()
ot_df = geo_df[df.minute == 21]
ota = ot_df.area_circle_polygon.values
ot_lon = ot_df.centroid.x.values[0]
ot_lat = ot_df.centroid.y.values[0]
shift_x = ot_df.lon_corr.values[0] - ot_lon
shift_y = ot_df.lat_corr.values[0] - ot_lat
ot_df = ot_df.translate(shift_x, shift_y)
lats = ds.lat.values
lons = ds.lon.values
w_vals = ds.where((ds.w > 0)& (ds.lat > -32.01) & (ds.lat < -31.95) & (ds.lon > -64.075) & (ds.lon < -64.02)).sel(z=slice(3000, 12000)).w
ds_w = ds.where((ds.w > 0)& (ds.lat > -32.01) & (ds.lat < -31.95) & (ds.lon > -64.075) & (ds.lon < -64.02)).sel(z=slice(3000, 10000)).w.mean(dim='z').values
ds_wmax = ds.where((ds.w > 0) & (ds.lat > -32.05) & (ds.lon < -64.1)).sel(z=slice(3000, 12000)).w.max(dim=['x','y'])
ref = ds.sel(z=1500).ZM_composite.values
w_max_list.append(ds_wmax)

areas, levels = calc_updraft_area(w_vals, 4)
w_area_list.append(xr.DataArray(areas, coords={'z':levels,
                  'time':ds_wmax.time}, dims={'z':levels}))

np.nanmax(ds_wmax)
/Users/mgrover/miniconda3/envs/unidata/lib/python3.7/site-packages/ipykernel_launcher.py:15: RuntimeWarning: invalid value encountered in greater
  from ipykernel import kernelapp as app
21.391447884993497
ot_df
time
2018-11-10 20:20:55.000000512    POLYGON ((-64.05492 -32.03372, -64.03147 -32.0...
dtype: geometry
w = ds_w
count = len(w[np.where(w > 4)]) * .25
w_mean = np.mean(w[np.where(w > 4)])
/Users/mgrover/miniconda3/envs/unidata/lib/python3.7/site-packages/ipykernel_launcher.py:1: RuntimeWarning: invalid value encountered in greater
  """Entry point for launching an IPython kernel.
/Users/mgrover/miniconda3/envs/unidata/lib/python3.7/site-packages/ipykernel_launcher.py:2: RuntimeWarning: invalid value encountered in greater
print(w_mean)
7.4361382325885055
fig = plt.figure(figsize=(12,8))

ax = plt.subplot(111, projection=ccrs.PlateCarree())

cf = plt.pcolormesh(lons, lats,ref , vmin=10, vmax=50, cmap='pyart_Carbone17')
cb1 = plt.colorbar(cf, shrink=.7)
cb1.set_label('Reflectivity (dBZ)', fontsize=16)
cb1.ax.tick_params(labelsize=16)

#q = ax.quiver(lons[::2], lats[::2], u_wnd[::2], v_wnd[::2], pivot='mid', color='black', scale=50, scale_units='inches')

#ax.quiverkey(q, X=.95, Y=.1, U=10, label='10 m/s', labelpos='W')

w_mask = np.nan_to_num(w)
cf = plt.contour(lons, lats, w_mask , levels=[4, 30], colors=['black'], linestyles='--', linewidth=3)
#cb = plt.colorbar(cf, shrink=.7)
#cb.set_label('Vertical Velocity (m/s)', fontsize=16)
cb1.ax.tick_params(labelsize=16)

ot_df.plot(ax=ax, facecolor="none",
              edgecolor='black',linewidth=3, label='otarea')

gl = ax.gridlines(crs=ccrs.PlateCarree(), draw_labels=True,
                  linewidth=2, color='gray', alpha=0.5, linestyle='--')
gl.top_labels = False
gl.left_labels= True
gl.right_labels = False
gl.xlabel_style = {'size': 16, 'color': 'k'}
gl.ylabel_style = {'size': 16, 'color': 'k'}

ax.set_extent((-64.3, -63.9, -32.2, -31.9))

plt.plot(0,0, color='black', label=f'OT Area: {ota[0].round(2)} $km^{2}$ ', linewidth=3)
plt.plot(0,0, color='black', label=f'Updraft Area: {count} $km^{2}$', linewidth=3, linestyle='--')

plt.legend(loc='upper left', fontsize=14)

plt.title('Reflectivty at 1.5 km \n and Mean Updraft 5-10 km \n 10 November 2018 2021 UTC', fontsize=16)

plt.savefig('summary_figs/Nov_10_2018_2020.png', dpi=400)
/Users/mgrover/miniconda3/envs/unidata/lib/python3.7/site-packages/cartopy/mpl/geoaxes.py:1478: UserWarning: The following kwargs were not used by contour: 'linewidth'
  result = matplotlib.axes.Axes.contour(self, *args, **kwargs)
ds_wmax = xr.concat(w_max_list, 'time')
ds_warea = xr.concat(w_area_list, 'time')
ds_wmax = ds_wmax.sortby('time')
ds_warea = ds_warea.sortby('time')
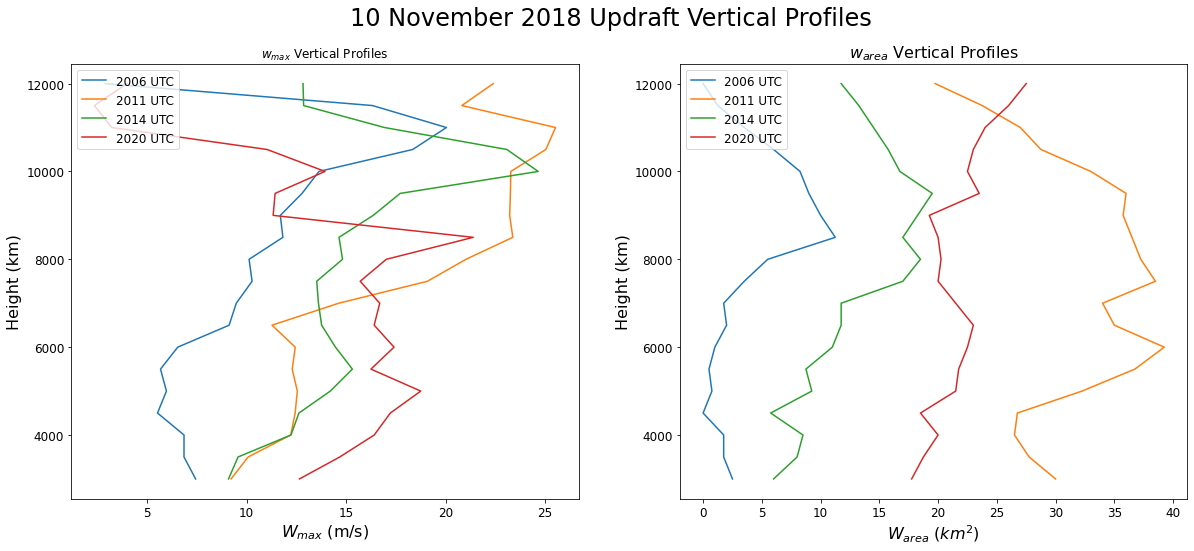
fig = plt.figure(figsize=(20,8))

colors = ['tab:blue', 'tab:orange', 'tab:green', 'tab:red']

for time in range(len(ds_wmax.time)):
    ds_w = ds_wmax.isel(time=time)
    ds_wa = ds_warea.isel(time=time)
    mean_w = np.nanmean(ds_w)
    max_w = np.nanmax(ds_w)
    timestamp = int(pd.to_datetime(ds_w.time.values).strftime('%H%M'))

    ax = plt.subplot(121)
    ax.plot(ds_w.values, ds_w.z, label=f'{timestamp} UTC', color=colors[time])
    wmax = '$w_{max}$'
    #ax.axvline(mean_w, label=f'Mean {wmax} in 5-10 km layer {np.round(mean_w, 2)} m/s', linestyle=':', color=colors[time])
    #ax.axvline(max_w, label=f'Max {wmax} in 5-10 km layer {np.round(max_w, 2)} m/s', linestyle='--', color=colors[time])
    plt.title('$w_{max}$ Vertical Profiles')
    plt.xticks(fontsize=12)
    plt.yticks(fontsize=12)

    plt.xlabel('$W_{max}$ (m/s)', fontsize=16)
    plt.ylabel('Height (km)', fontsize=16)

    plt.legend(loc='upper left', fontsize=12)

    ax2 = plt.subplot(122)
    ax2.plot(ds_wa.values, ds_wa.z, label=f'{timestamp} UTC', color=colors[time])

    plt.title('$w_{area}$ Vertical Profiles', fontsize=16)
    plt.xticks(fontsize=12)
    plt.yticks(fontsize=12)

    plt.xlabel('$W_{area}$ ($km^2$)', fontsize=16)
    plt.ylabel('Height (km)', fontsize=16)

    plt.legend(loc='upper left', fontsize=12)


plt.suptitle('10 November 2018 Updraft Vertical Profiles', fontsize=24)

plt.savefig('Vertical_w_prof_10_nov.png', dpi=400)
/Users/mgrover/miniconda3/envs/unidata/lib/python3.7/site-packages/ipykernel_launcher.py:12: MatplotlibDeprecationWarning: Adding an axes using the same arguments as a previous axes currently reuses the earlier instance.  In a future version, a new instance will always be created and returned.  Meanwhile, this warning can be suppressed, and the future behavior ensured, by passing a unique label to each axes instance.
  if sys.path[0] == '':
/Users/mgrover/miniconda3/envs/unidata/lib/python3.7/site-packages/ipykernel_launcher.py:26: MatplotlibDeprecationWarning: Adding an axes using the same arguments as a previous axes currently reuses the earlier instance.  In a future version, a new instance will always be created and returned.  Meanwhile, this warning can be suppressed, and the future behavior ensured, by passing a unique label to each axes instance.
geo_df['times'] = pd.to_numeric(geo_df.index.strftime('%H%M')) + 1
geo_df = geo_df[geo_df.times <= 2021]
#geo_df['times'] = pd.to_numeric(geo_df.index.strftime('%H%M')) + 1
trop_temps = geo_df.tropopause_temperature.values
trop_height = geo_df.tropopause_height.values

ct_height = geo_df.cloudtop_height.values
ot_temp = geo_df.mintb.values

btd = ot_temp - trop_temps
depth = ct_height - trop_height
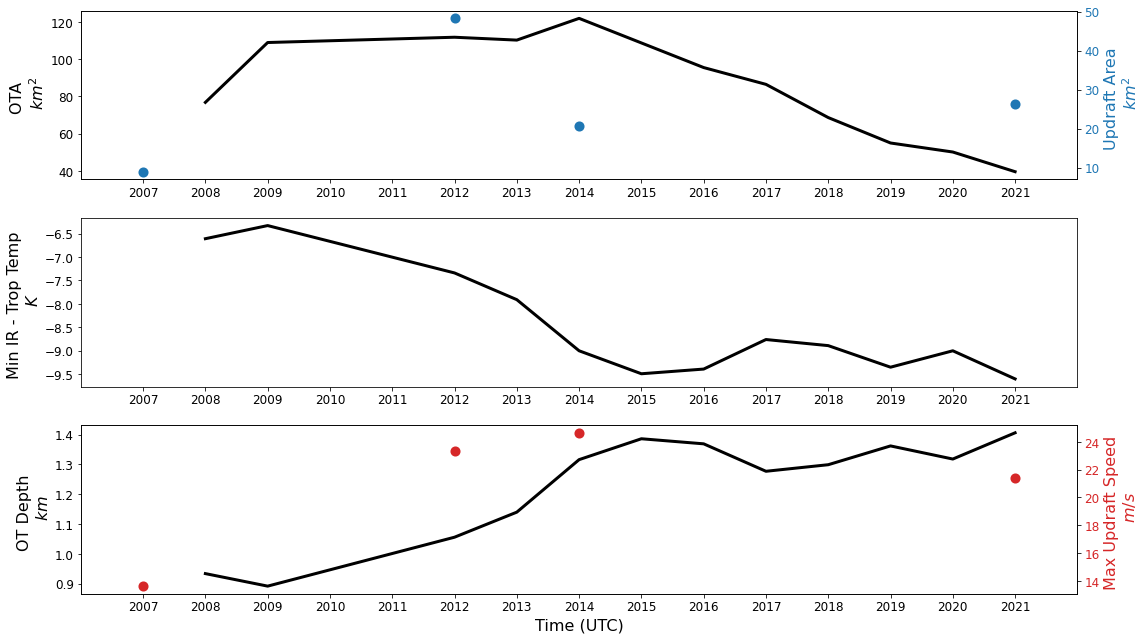
nov10_times = np.array([2007, 2012, 2014, 2021])
nov10_ua = [9., 48.25, 20.75, 26.25]
nov10_wmax = [13.63, 23.37, 24.65, 21.39]

times = geo_df.times
ticks = np.arange(2007, 2022, 1)
times - 1
time
2018-11-10 20:07:55.000000512    2007
2018-11-10 20:08:55.000000512    2008
2018-11-10 20:11:55.000000512    2011
2018-11-10 20:12:55.000000512    2012
2018-11-10 20:13:55.000000512    2013
2018-11-10 20:14:55.000000512    2014
2018-11-10 20:15:55.000000512    2015
2018-11-10 20:16:55.000000512    2016
2018-11-10 20:17:55.000000512    2017
2018-11-10 20:18:55.000000512    2018
2018-11-10 20:19:55.000000512    2019
2018-11-10 20:20:55.000000512    2020
Name: times, dtype: int64
plt.figure(figsize=(16,9))
ax = plt.subplot(311)


ota = geo_df.area_circle_polygon
times = geo_df.times

ax.plot(geo_df.times, ota, linewidth=3, color='black')

max_ota = ota.max()

ind = np.where(ota == max_ota)[0][0]

#plt.axhline(ota[ind], linestyle='--', label=f'Max OTA {round(float(max_ota), 2)} $km^{2}$',
#            color='k', linewidth=3)
#ax.scatter(df_sub.datetime, df_sub.area_polygon, s=80, color='black')

plt.yticks(fontsize=12)
plt.xticks(ticks, fontsize=12)

plt.ylabel('OTA \n $km^{2}$', fontsize=16)

ax_1 = plt.twinx()

ax_1.scatter(nov10_times, nov10_ua, linewidth=3, color='tab:blue', linestyle='-', label='Tropopause Height', s=50)

#ax_1.plot(geo_df.times, ota*.4032, linewidth=3, color='tab:blue', linestyle=':')

plt.ylabel('Updraft Area \n $km^{2}$', fontsize=16, color='tab:blue')
plt.xlabel('Time', fontsize=16)

plt.yticks(fontsize=12, color='tab:blue')

plt.yticks(fontsize=12)
plt.xticks(fontsize=12)
plt.xlim(2006, 2022)

#plt.legend(loc='lower left', fontsize=16)

ax2 = plt.subplot(312)
ax2.plot(times, btd, linewidth=3, color='black', linestyle='-', label='BTD')
#ax2.plot(times, ot_temp, linewidth=3, color='blue')

plt.yticks(fontsize=12)
plt.xticks(ticks, fontsize=12)
plt.xlim(2006, 2022)

#ax2.scatter(df_sub.datetime, df_sub.mintb, s=80, color='black')

plt.ylabel('Min IR - Trop Temp \n $K$', fontsize=16)

ax3 = plt.subplot(313)
ax3.plot(times, depth, linewidth=3, color='black', linestyle='-', label='Tropopause Height')

#ax3.plot(times, ct_height, linewidth=3, color='red')
#ax3.scatter(df_sub.datetime, df_sub.cloudtop_height.values[0], s=80, color='black')

plt.ylabel('OT Depth \n $km$', fontsize=16)
plt.xlabel('Time (UTC)', fontsize=16)
plt.yticks(fontsize=12)
plt.xticks(ticks, fontsize=12)

ax_3 = ax3.twinx()
ax_3.scatter(nov10_times, nov10_wmax, linewidth=3, color='tab:red', linestyle='-', label='Tropopause Height', s=50)


plt.ylabel('Max Updraft Speed \n $m/s$', fontsize=16, color='tab:red')
plt.xlabel('Time (UTC)', fontsize=16)

plt.yticks(fontsize=12, color='tab:red')
plt.xticks(fontsize=12, color='tab:red')
plt.xlim(2006, 2022)


#plt.legend(loc='lower left', fontsize=16)

#ax4 = plt.subplot(514)
#ax4.plot(nov12_times, nov12_ua, linewidth=3, color='tab:blue', linestyle='-', label='Tropopause Height')
#ax3.plot(times, ct_height, linewidth=3, color='red')

#plt.ylabel('Updraft Area \n $km^{2}$', fontsize=16)
#plt.xlabel('Time', fontsize=16)


#ax4 = plt.subplot(515)
#ax4.plot(nov12_times, nov12_wmax, linewidth=3, color='tab:green', linestyle='-', label='Tropopause Height')
#ax3.plot(times, ct_height, linewidth=3, color='red')

#plt.ylabel('Max Updraft Speed \n $m/s$', fontsize=16)
#plt.xlabel('Time', fontsize=16)


#plt.suptitle(f'10 November 2018 Supercell \n {df_sub.datetime.values[0]} UTC', fontsize=24)
    #plt.savefig(f'compare_plots/time_series_{timestamp}.png', dpi=200)

#plt.suptitle()

plt.tight_layout()

plt.savefig('10_November_Time_Series.png', dpi=300)

plt.show()
plt.close()
import numpy as np
import matplotlib.pyplot as plt
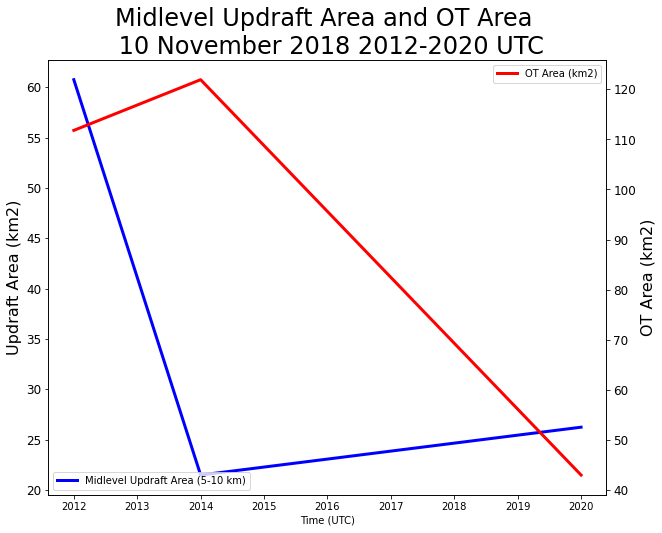
w = np.array([60.75, 21.5, 26.25])
ota = np.array([111.81, 121.94, 42.94])
times = np.array([2012, 2014, 2020])
plt.figure(figsize=(10,8))

ax = plt.subplot(111)

ax.plot(times, w, color='blue', linewidth=3, label='Midlevel Updraft Area (5-10 km)')
plt.legend(loc='lower left')
plt.xlabel('Time (UTC)')
plt.ylabel('Updraft Area (km2)', fontsize=16)
plt.yticks(fontsize=12)

ax2 = ax.twinx()
ax2.plot(times, ota, color='red', linewidth=3, label='OT Area (km2)')
plt.xlabel('Time (UTC)', fontsize=16)
plt.ylabel('OT Area (km2)', fontsize=16)
plt.yticks(fontsize=12)

plt.title('Midlevel Updraft Area and OT Area \n 10 November 2018 2012-2020 UTC', fontsize=24)

plt.legend()
<matplotlib.legend.Legend at 0x7f90b74dd750>
nov_10_peak_area = np.max(w)
nov_10_peak_ota = np.max(ota)
print(nov_10_peak_area, nov_10_peak_ota)
60.75 121.94
13-14 December Case
df= pd.read_csv('ot_output/Revised_OTs_14_Dec_2018_0214_0225.csv', index_col='time', parse_dates=True)
df['ot_depth'] = df.cloudtop_height - df.tropopause_height
ds = xr.open_dataset('dual_output/Dec13_new/Dec13_0217.nc').squeeze()
df['minute'] = df.index.minute
from shapely import wkt

df['geometry'] = df['geometry'].apply(wkt.loads)
geo_df = gpd.GeoDataFrame(df, geometry='geometry')
df_sub = geo_df[df.minute == 16]
ot_df = df_sub[df_sub.lat == df_sub.lat.values[0]]
ota = ot_df.area_circle_polygon.values
ot_lon = ot_df.centroid.x.values[0]
ot_lat = ot_df.centroid.y.values[0]
shift_x = ot_df.lon_corr.values[0] - ot_lon
shift_y = ot_df.lat_corr.values[0] - ot_lat
ot_df = ot_df.translate(shift_x, shift_y)
lats = ds.lat.values
lons = ds.lon.values
w_vals = ds.where((ds.w > 0) & (ds.lat > -31.848) & (ds.lat < -31.75) & (ds.lon > -64.45) & (ds.lon < -64.34)).sel(z=slice(3000, 12000)).w
ds_w = ds.where((ds.w > 0) & (ds.lat > -31.848) & (ds.lat < -31.75) & (ds.lon > -64.45) & (ds.lon < -64.34)).sel(z=slice(5000, 10000)).w.mean(dim='z').values
ds_wmax = ds.where((ds.w > 0) & (ds.lat > -31.848) & (ds.lat < -31.75) & (ds.lon > -64.45) & (ds.lon < -64.34)).sel(z=slice(3000, 12000)).w.max(dim=['x','y'])
ref = ds.where(ds.ZM_composite > -5).sel(z=1500).ZM_composite.values
w_max_list = []
w_area_list = []

areas, levels = calc_updraft_area(w_vals, 9)
w_area_list.append(xr.DataArray(areas, coords={'z':levels,
                  'time':ds_wmax.time}, dims={'z':levels}))

w_max_list.append(ds_wmax)
np.nanmax(ds_wmax)
/Users/mgrover/miniconda3/envs/unidata/lib/python3.7/site-packages/ipykernel_launcher.py:15: RuntimeWarning: invalid value encountered in greater
  from ipykernel import kernelapp as app
33.699421025179255
w_vals = ds.where((ds.w > 0)).sel(z=slice(5000, 10000)).w.mean(dim='z').fillna(0).values
w = ds_w
updraft_area = len(w[np.where(ds_w > 9)]) * .25
w_mean = np.nanmean(w[np.where(ds_w > 9)])
/Users/mgrover/miniconda3/envs/unidata/lib/python3.7/site-packages/ipykernel_launcher.py:1: RuntimeWarning: invalid value encountered in greater
  """Entry point for launching an IPython kernel.
/Users/mgrover/miniconda3/envs/unidata/lib/python3.7/site-packages/ipykernel_launcher.py:2: RuntimeWarning: invalid value encountered in greater
w[np.where(ds_w > 9)]
/Users/mgrover/miniconda3/envs/unidata/lib/python3.7/site-packages/ipykernel_launcher.py:1: RuntimeWarning: invalid value encountered in greater
  """Entry point for launching an IPython kernel.
array([ 9.27682878, 17.35000961, 13.98963072,  9.19823161, 14.65811561,
       13.8433275 , 10.5740579 , 12.56915881, 16.75180319, 20.95796565,
       21.42135826, 17.358596  , 12.92547687,  9.43874279, 10.72486157,
       13.50187222, 20.35497954, 21.1241165 , 19.40954137, 14.52802601,
        9.11925453, 11.56321234, 18.64645158, 18.75561175, 14.52491434,
       11.31667959, 10.17463817, 12.32169494, 12.55943408, 19.21351158,
       21.19138609, 15.26660814, 16.47336712, 19.21252224, 21.21332974,
       21.04318716, 11.27369554, 10.69152069, 13.57239195, 20.3514361 ,
       23.83480757, 23.57636473, 22.59575899, 11.78564587, 13.20858526,
       18.56239851, 20.55815508, 18.28618062, 12.98505501, 12.14690831,
       13.81652015])
w = np.nan_to_num(w)
ds_sub = ds.sel(z=1500)

ax = plt.subplot(111, projection=ccrs.PlateCarree())
u_wnd = ds_sub.u.values
v_wnd = ds_sub.v.values
w_wnd = ds_sub.w.values

lons, lats = np.meshgrid(ds.lon.values, ds.lat.values)

fig = plt.figure(figsize=(12,8))

ax = plt.subplot(111, projection=ccrs.PlateCarree())

cf = plt.pcolormesh(lons, lats,ref , vmin=10, vmax=50, cmap='pyart_Carbone17')
cb1 = plt.colorbar(cf, label='Reflectivity (dBZ)', shrink=.7)
cb1.set_label('Reflectivity (dBZ)', fontsize=16)
cb1.ax.tick_params(labelsize=16)

w_mask = w
cf = plt.contour(lons, lats, w_mask , levels=[9, 30], colors=['black'], linestyles='--', linewidth=3)
#cb = plt.colorbar(cf, shrink=.7)
#cb.set_label('Vertical Velocity (m/s)', fontsize=16)
cb1.ax.tick_params(labelsize=16)

ot_df.plot(ax=ax, facecolor="none",
              edgecolor='black',linewidth=3, label='otarea')

gl = ax.gridlines(crs=ccrs.PlateCarree(), draw_labels=True,
                  linewidth=2, color='gray', alpha=0.5, linestyle='--')
gl.top_labels = False
gl.left_labels= True
gl.right_labels = False
gl.xlabel_style = {'size': 16, 'color': 'k'}
gl.ylabel_style = {'size': 16, 'color': 'k'}

ax.set_extent((-64.5, -64.1, -31.9, -31.5))

plt.plot(0,0, color='black', label=f'OT Area: {ota[0].round(2)} $km^{2}$ ', linewidth=3)
plt.plot(0,0, color='black', label=f'Updraft Area: {updraft_area} $km^{2}$', linewidth=3, linestyle='--')

plt.legend(loc='upper left', fontsize=14)

plt.title('Reflectivty at 1.5 km \n and Mean Updraft 5-10 km \n 13 December 2018 2017 UTC', fontsize=16)

plt.savefig('summary_figs/Dec_14_0217.png', dpi=400)
/Users/mgrover/miniconda3/envs/unidata/lib/python3.7/site-packages/cartopy/mpl/geoaxes.py:1478: UserWarning: The following kwargs were not used by contour: 'linewidth'
  result = matplotlib.axes.Axes.contour(self, *args, **kwargs)
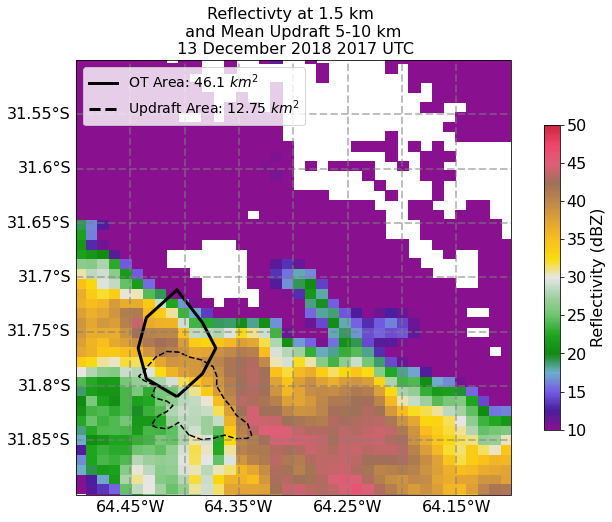
14 December 2018 2020 UTC
df= pd.read_csv('ot_output/Revised_OTs_14_Dec_2018_0214_0225.csv', index_col='time', parse_dates=True)
df.area_circle_polygon
time
2018-12-14 02:15:25.000000512    40.137743
2018-12-14 02:16:25.000000512    46.100451
2018-12-14 02:17:25.000000512    39.036624
2018-12-14 02:18:25.000000512    69.240941
2018-12-14 02:19:25.000000512    74.079337
2018-12-14 02:20:25.000000512    67.684649
2018-12-14 02:21:25.000000512    64.809910
2018-12-14 02:22:25.000000512    51.882368
2018-12-14 02:23:25.000000512    56.217753
2018-12-14 02:24:25.000000512    37.921218
2018-12-14 02:25:25.000000512    38.579593
2018-12-14 02:26:25.000000512    48.283925
Name: area_circle_polygon, dtype: float64
ds = xr.open_dataset('dual_output/Dec13/Dec13_0220.nc').squeeze()
df['minute'] = df.index.minute
df_sub = geo_df[df.minute == 21]
ot_df = df_sub[df_sub.lat == df_sub.lat.values[0]]
ota = ot_df.area_circle_polygon.values
ot_lon = ot_df.centroid.x.values[0]
ot_lat = ot_df.centroid.y.values[0]
shift_x = ot_df.lon_corr.values[0] - ot_lon
shift_y = ot_df.lat_corr.values[0] - ot_lat
ot_df = ot_df.translate(shift_x, shift_y)
lats = ds.lat.values
lons = ds.lon.values
w_vals = ds.where((ds.w > 0) & (ds.lat > -31.9) & (ds.lat < -31.75) & (ds.lon > -64.4) & (ds.lon < -64.33)).sel(z=slice(3000, 12000)).w
ds_w = ds.where((ds.w > 0) & (ds.lat > -31.9) & (ds.lat < -31.75) & (ds.lon > -64.4) & (ds.lon < -64.33)).sel(z=slice(5000, 10000)).w.mean(dim='z').values
ds_wmax = ds.where((ds.w > 0) & (ds.lat > -31.9) & (ds.lat < -31.75) & (ds.lon > -64.4) & (ds.lon < -64.33)).sel(z=slice(3000, 12000)).w.max(dim=['x','y'])
ref = ds.where(ds.ZM_composite > -5).sel(z=1500).ZM_composite.values
w_max_list.append(ds_wmax)


areas, levels = calc_updraft_area(w_vals, 9)
w_area_list.append(xr.DataArray(areas, coords={'z':levels,
                  'time':ds_wmax.time}, dims={'z':levels}))
np.nanmax(ds_wmax)
/Users/mgrover/miniconda3/envs/unidata/lib/python3.7/site-packages/ipykernel_launcher.py:15: RuntimeWarning: invalid value encountered in greater
  from ipykernel import kernelapp as app
26.627381567116956
w_vals = ds.where((ds.w > 0)).sel(z=slice(6000, 10000)).w.mean(dim='z').values
w = ds_w
updraft_area = len(w[np.where(ds_w > 8)]) * .25
w_mean = np.nanmean(w[np.where(ds_w > 8)])
/Users/mgrover/miniconda3/envs/unidata/lib/python3.7/site-packages/ipykernel_launcher.py:1: RuntimeWarning: invalid value encountered in greater
  """Entry point for launching an IPython kernel.
/Users/mgrover/miniconda3/envs/unidata/lib/python3.7/site-packages/ipykernel_launcher.py:2: RuntimeWarning: invalid value encountered in greater
print(w_mean)
11.13791089381304
fig = plt.figure(figsize=(12,8))

ax = plt.subplot(111, projection=ccrs.PlateCarree())

cf = plt.pcolormesh(lons, lats,ref , vmin=10, vmax=50, cmap='pyart_Carbone17')
cb1 = plt.colorbar(cf, shrink=.7)
cb1.set_label('Reflectivity (dBZ)', fontsize=16)
cb1.ax.tick_params(labelsize=16)

#q = ax.quiver(lons[::2], lats[::2], u_wnd[::2], v_wnd[::2], pivot='mid', color='black', scale=50, scale_units='inches')

#ax.quiverkey(q, X=.95, Y=.1, U=10, label='10 m/s', labelpos='W')

w_mask = np.nan_to_num(w)
cf = plt.contour(lons, lats, w_mask , levels=[9,30], colors=['black'], linestyles='--', linewidth=3)
#cb = plt.colorbar(cf, shrink=.7)
#cb.set_label('Vertical Velocity (m/s)', fontsize=16)
cb1.ax.tick_params(labelsize=16)

ot_df.plot(ax=ax, facecolor="none",
              edgecolor='black',linewidth=3, label='otarea')

gl = ax.gridlines(crs=ccrs.PlateCarree(), draw_labels=True,
                  linewidth=2, color='gray', alpha=0.5, linestyle='--')
gl.top_labels = False
gl.left_labels= True
gl.right_labels = False
gl.xlabel_style = {'size': 16, 'color': 'k'}
gl.ylabel_style = {'size': 16, 'color': 'k'}

ax.set_extent((-64.5, -64.1, -31.9, -31.5))

plt.plot(0,0, color='black', label=f'OT Area: {ota[0].round(2)} $km^{2}$ ', linewidth=3)
plt.plot(0,0, color='black', label=f'Updraft Area: {updraft_area} $km^{2}$', linewidth=3, linestyle='--')

plt.legend(loc='upper left', fontsize=14)

plt.title('Reflectivity at 1.5 km \n and Mean Updraft 5-10 km \n 13 December 2018 2022 UTC', fontsize=16)

plt.savefig('summary_figs/Dec_14_0222.png', dpi=400)
/Users/mgrover/miniconda3/envs/unidata/lib/python3.7/site-packages/cartopy/mpl/geoaxes.py:1478: UserWarning: The following kwargs were not used by contour: 'linewidth'
  result = matplotlib.axes.Axes.contour(self, *args, **kwargs)
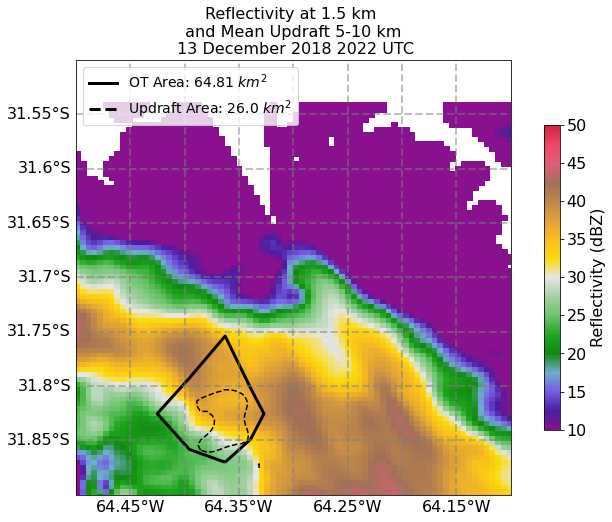
#geo_df['times'] = pd.to_numeric(geo_df.index.strftime('%H%M'))

geo_df['times'] = pd.to_numeric(geo_df.index.strftime('%H%M'))
geo_df = geo_df[geo_df.times <= 226]
trop_temps = geo_df.tropopause_temperature.values
trop_height = geo_df.tropopause_height.values

ct_height = geo_df.cloudtop_height.values
ot_temp = geo_df.mintb.values

btd = ot_temp - trop_temps
depth = ct_height - trop_height
dec14_times = np.array([216, 221, 226])
dec14_ua = [38., 26., 16.25]
dec14_wmax = [27.52, 26.03, 25.21]
ticks = np.arange(215, 227, 1)
plt.figure(figsize=(16,9))
ax = plt.subplot(311)


ota = geo_df.area_circle_polygon
times = geo_df.times

ax.plot(geo_df.times, ota, linewidth=3, color='black')

max_ota = ota.max()

ind = np.where(ota == max_ota)[0][0]

#plt.axhline(ota[ind], linestyle='--', label=f'Max OTA {round(float(max_ota), 2)} $km^{2}$',
#            color='k', linewidth=3)
#ax.scatter(df_sub.datetime, df_sub.area_polygon, s=80, color='black')

plt.yticks(fontsize=12)
plt.xticks(ticks, fontsize=12)

plt.ylabel('OTA \n $km^{2}$', fontsize=16)

ax_1 = plt.twinx()

ax_1.scatter(dec14_times, dec14_ua, linewidth=3, color='tab:blue', linestyle='-', label='Observed Updraft Area', s=50)

#ax_1.plot(geo_df.times, ota*.4032, linewidth=3, color='tab:blue', linestyle=':', label='OTA Derived Updraft Area')

plt.ylabel('Updraft Area \n $km^{2}$', fontsize=16, color='tab:blue')
plt.xlabel('Time', fontsize=16)

plt.yticks(fontsize=12, color='tab:blue')

plt.xticks(fontsize=12)

ax2 = plt.subplot(312)
ax2.plot(geo_df.times, btd, linewidth=3, color='black', linestyle='-', label='BTD')
#ax2.plot(times, ot_temp, linewidth=3, color='blue')

plt.yticks(fontsize=12)
plt.xticks(ticks, fontsize=12)

#ax2.scatter(df_sub.datetime, df_sub.mintb, s=80, color='black')

plt.ylabel('Min IR - Trop Temp \n $K$', fontsize=16)

ax3 = plt.subplot(313)
ax3.plot(geo_df.times, depth, linewidth=3, color='black', linestyle='-', label='Tropopause Height')

#ax3.plot(times, ct_height, linewidth=3, color='red')
#ax3.scatter(df_sub.datetime, df_sub.cloudtop_height.values[0], s=80, color='black')

plt.ylabel('OT Depth \n $km$', fontsize=16)
plt.xlabel('Time (UTC)', fontsize=16)
plt.yticks(fontsize=12)
plt.xticks(ticks, fontsize=12)

ax_3 = ax3.twinx()
ax_3.scatter(dec14_times, dec14_wmax, linewidth=3, color='tab:red', linestyle='-', label='Tropopause Height', s=50)


plt.ylabel('Max Updraft Speed \n $m/s$', fontsize=16, color='tab:red')
plt.xlabel('Time (UTC)', fontsize=16)

plt.yticks(fontsize=12, color='tab:red')
plt.xticks(fontsize=12, color='tab:red')


#plt.legend(loc='lower left', fontsize=16)

#ax4 = plt.subplot(514)
#ax4.plot(nov12_times, nov12_ua, linewidth=3, color='tab:blue', linestyle='-', label='Tropopause Height')
#ax3.plot(times, ct_height, linewidth=3, color='red')

#plt.ylabel('Updraft Area \n $km^{2}$', fontsize=16)
#plt.xlabel('Time', fontsize=16)


#ax4 = plt.subplot(515)
#ax4.plot(nov12_times, nov12_wmax, linewidth=3, color='tab:green', linestyle='-', label='Tropopause Height')
#ax3.plot(times, ct_height, linewidth=3, color='red')

#plt.ylabel('Max Updraft Speed \n $m/s$', fontsize=16)
#plt.xlabel('Time', fontsize=16)


#plt.suptitle(f'10 November 2018 Supercell \n {df_sub.datetime.values[0]} UTC', fontsize=24)
    #plt.savefig(f'compare_plots/time_series_{timestamp}.png', dpi=200)

#plt.suptitle()

plt.tight_layout()

plt.savefig('14_December_Time_Series.png', dpi=300)

plt.show()
plt.close()
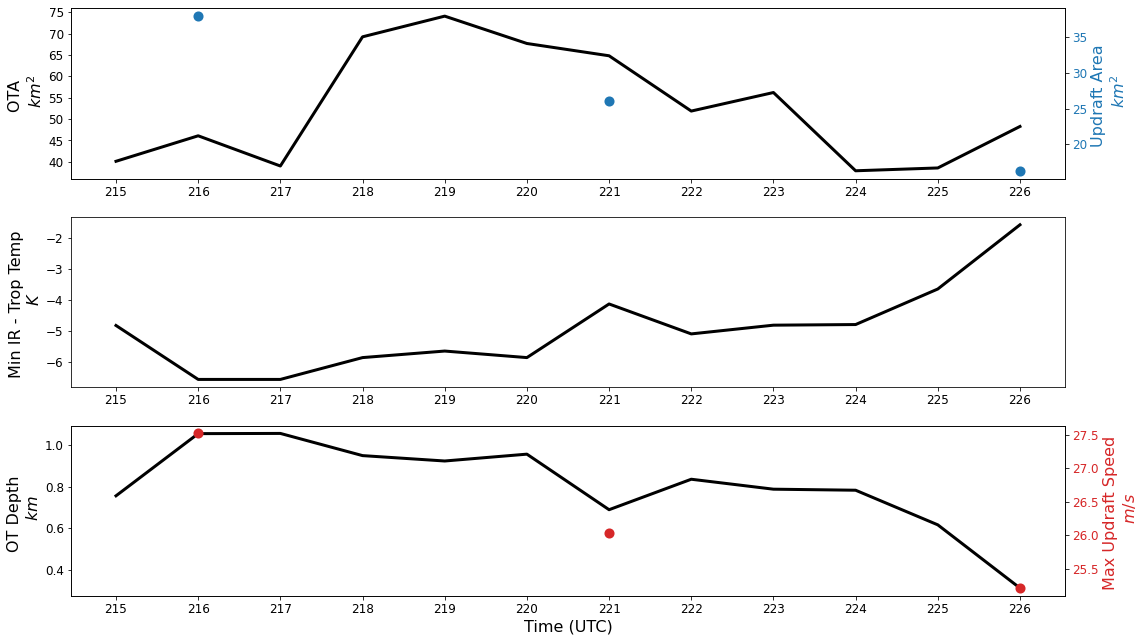
geo_df[geo_df.minute < 25].area_circle_polygon.plot()
<matplotlib.axes._subplots.AxesSubplot at 0x7fdaf45639d0>
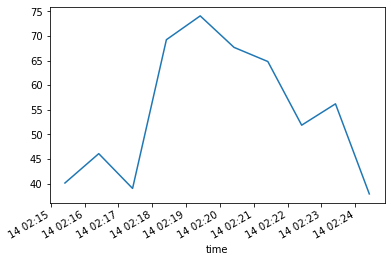
geo_df[geo_df.minute < 25].cloudtop_height.plot()
geo_df[geo_df.minute < 25].tropopause_height.plot()
<matplotlib.axes._subplots.AxesSubplot at 0x7fdafa852450>
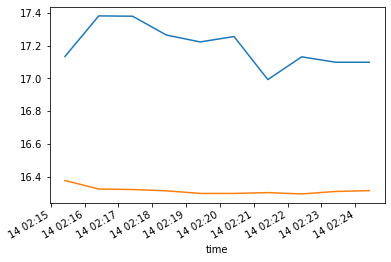
14 December 2025 UTC
df= pd.read_csv('ot_output/Revised_OTs_14_Dec_2018_0214_0225.csv', index_col='time', parse_dates=True)
ds = xr.open_dataset('dual_output/Dec14/Dec14_0225.nc').squeeze()
df['minute'] = df.index.minute
df_sub = geo_df[df.minute == 25]
ot_df = df_sub[df_sub.lat == df_sub.lat.values[0]]
ota = ot_df.area_circle_polygon.values
ot_lon = ot_df.centroid.x.values[0]
ot_lat = ot_df.centroid.y.values[0]
shift_x = ot_df.lon_corr.values[0] - ot_lon
shift_y = ot_df.lat_corr.values[0] - ot_lat
ot_df = ot_df.translate(shift_x, shift_y)
lats = ds.lat.values
lons = ds.lon.values
w_vals = ds.where((ds.w > 0) & (ds.lat > -31.935) & (ds.lat < -31.8) & (ds.lon > -64.4) & (ds.lon < -64.18)).sel(z=slice(3000, 12000)).w
ds_w = ds.where((ds.w > 0) & (ds.lat > -31.935) & (ds.lat < -31.8) & (ds.lon > -64.4) & (ds.lon < -64.18)).sel(z=slice(5000, 10000)).w.mean(dim='z').values
ds_wmax = ds.where((ds.w > 0) & (ds.lat > -31.935) & (ds.lat < -31.8) & (ds.lon > -64.4) & (ds.lon < -64.18)).sel(z=slice(3000, 12000)).w.max(dim=['x','y'])
ref = ds.where(ds.ZM_composite > -5).sel(z=1500).ZM_composite.values
w_max_list.append(ds_wmax)
np.nanmax(ds_wmax)

areas, levels = calc_updraft_area(w_vals, 9)
w_area_list.append(xr.DataArray(areas, coords={'z':levels,
                  'time':ds_wmax.time}, dims={'z':levels}))
/Users/mgrover/miniconda3/envs/unidata/lib/python3.7/site-packages/ipykernel_launcher.py:15: RuntimeWarning: invalid value encountered in greater
  from ipykernel import kernelapp as app
w_vals = ds.where((ds.w > 0)).sel(z=slice(6000, 10000)).w.mean(dim='z').values
w = ds_w
updraft_area = len(w[np.where(ds_w > 9)]) * .25
/Users/mgrover/miniconda3/envs/unidata/lib/python3.7/site-packages/ipykernel_launcher.py:1: RuntimeWarning: invalid value encountered in greater
  """Entry point for launching an IPython kernel.
w_mean = np.nanmean(w[np.where(ds_w > 9)])
/Users/mgrover/miniconda3/envs/unidata/lib/python3.7/site-packages/ipykernel_launcher.py:1: RuntimeWarning: invalid value encountered in greater
  """Entry point for launching an IPython kernel.
w_mean
12.867797103604888
fig = plt.figure(figsize=(12,8))

ax = plt.subplot(111, projection=ccrs.PlateCarree())

cf = plt.pcolormesh(lons, lats,ref , vmin=10, vmax=50, cmap='pyart_Carbone17')
cb1 = plt.colorbar(cf, label='Reflectivity (dBZ)', shrink=.7)

cb1.set_label('Reflectivity (dBZ)', fontsize=16)
cb1.ax.tick_params(labelsize=16)

w_mask = np.nan_to_num(w)
cf = plt.contour(lons, lats, w_mask , levels=[9,30], colors=['black'], linestyles='--', linewidth=3)
#cb = plt.colorbar(cf, shrink=.7)
#cb.set_label('Vertical Velocity (m/s)', fontsize=16)
cb1.ax.tick_params(labelsize=16)

ot_df.plot(ax=ax, facecolor="none",
              edgecolor='black',linewidth=3, label='otarea')

gl = ax.gridlines(crs=ccrs.PlateCarree(), draw_labels=True,
                  linewidth=2, color='gray', alpha=0.5, linestyle='--')
gl.top_labels = False
gl.left_labels= True
gl.right_labels = False
gl.xlabel_style = {'size': 16, 'color': 'k'}
gl.ylabel_style = {'size': 16, 'color': 'k'}

ax.set_extent((-64.5, -64.1, -31.9, -31.5))

plt.plot(0,0, color='black', label=f'OT Area: {ota[0].round(2)} $km^{2}$ ', linewidth=3)
plt.plot(0,0, color='black', label=f'Updraft Area: {updraft_area} $km^{2}$', linewidth=3, linestyle='--')

plt.legend(loc='upper left', fontsize=14)

plt.title('Reflectivty at 1.5 km \n and Mean Updraft 5-10 km \n 13 December 2018 2027 UTC', fontsize=16)

plt.savefig('summary_figs/Dec_14_0227.png', dpi=400)
/Users/mgrover/miniconda3/envs/unidata/lib/python3.7/site-packages/cartopy/mpl/geoaxes.py:1478: UserWarning: The following kwargs were not used by contour: 'linewidth'
  result = matplotlib.axes.Axes.contour(self, *args, **kwargs)
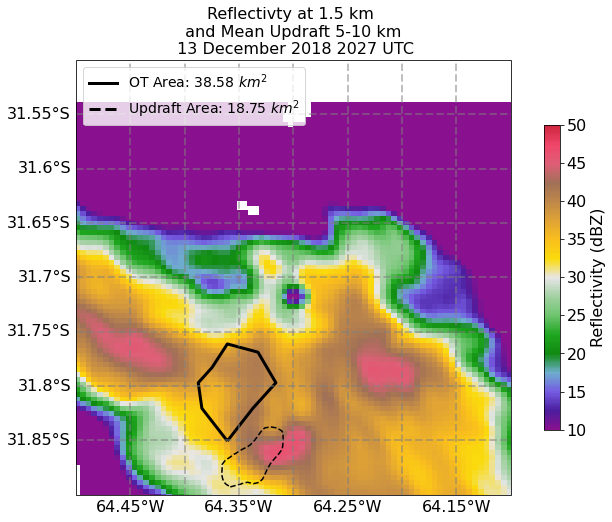
w = np.array([8.25, 6, 6])
ota = np.array([40.14, 67.68,  38.58])
times = np.array([2015, 2020, 2025])
plt.figure(figsize=(10,8))

ax = plt.subplot(111)

ax.plot(times, w, color='blue', linewidth=3, label='Midlevel Updraft Area (5-10 km)')
plt.legend(loc='upper left')
plt.xlabel('Time (UTC)')
plt.ylabel('Updraft Area (km2)', fontsize=16)
plt.yticks(fontsize=12)
plt.ylim(0,10)

ax2 = ax.twinx()
ax2.plot(times, ota, color='red', linewidth=3, label='OT Area (km2)')
plt.xlabel('Time (UTC)', fontsize=16)
plt.ylabel('OT Area (km2)', fontsize=16)
plt.yticks(fontsize=12)

plt.title('Midlevel Updraft Area and OT Area \n 14 December 2018 2015-2025 UTC', fontsize=24)

plt.ylim(0,100)

plt.legend()
<matplotlib.legend.Legend at 0x7fdad6a06ed0>
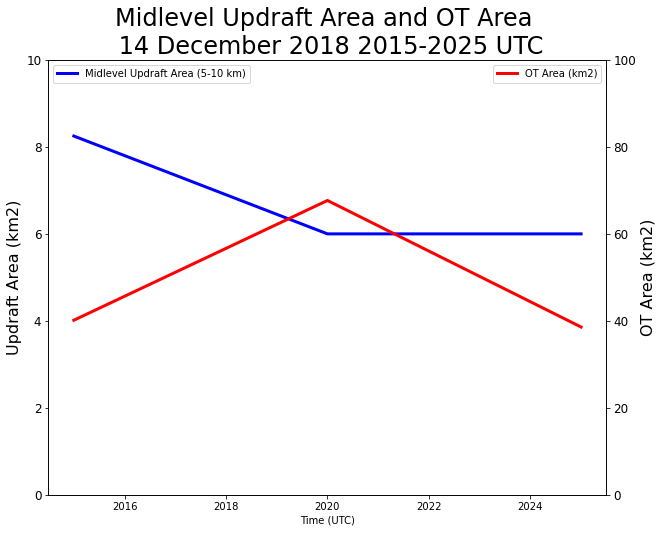
dec_14_peak_area = np.max(w)
dec_14_peak_ota = np.max(ota)
dec_14_peak_area
8.25
dec_14_peak_ota
67.68
ds_wmax = xr.concat(w_max_list, 'time')
ds_warea = xr.concat(w_area_list, 'time')
from datetime import timedelta
fig = plt.figure(figsize=(20,8))

colors = ['tab:blue', 'tab:orange', 'tab:green', 'tab:red']

for time in range(len(ds_wmax.time)):
    ds_w = ds_wmax.isel(time=time)
    ds_wa = ds_warea.isel(time=time)
    mean_w = np.nanmean(ds_w)
    max_w = np.nanmax(ds_w)
    timestamp = int((pd.to_datetime(ds_w.time.values) + timedelta(minutes=2)).strftime('%H%M'))

    ax = plt.subplot(121)
    ax.plot(ds_w.values, ds_w.z, label=f'{timestamp} UTC', color=colors[time])
    wmax = '$w_{max}$'
    #ax.axvline(mean_w, label=f'Mean {wmax} in 5-10 km layer {np.round(mean_w, 2)} m/s', linestyle=':', color=colors[time])
    #ax.axvline(max_w, label=f'Max {wmax} in 5-10 km layer {np.round(max_w, 2)} m/s', linestyle='--', color=colors[time])
    plt.title('$w_{max}$ Vertical Profiles', fontsize=16)
    plt.xticks(fontsize=12)
    plt.yticks(fontsize=12)

    plt.xlabel('$W_{max}$ (m/s)', fontsize=16)
    plt.ylabel('Height (km)', fontsize=16)

    plt.legend(loc='upper left', fontsize=12)

    ax2 = plt.subplot(122)
    ax2.plot(ds_wa.values, ds_wa.z, label=f'{timestamp} UTC', color=colors[time])

    plt.title('$w_{area}$ Vertical Profiles', fontsize=16)
    plt.xticks(fontsize=12)
    plt.yticks(fontsize=12)

    plt.xlabel('$W_{area}$ ($km^2$)', fontsize=16)
    plt.ylabel('Height (km)', fontsize=16)

    plt.legend(loc='upper left', fontsize=12)


plt.suptitle('14 December 2018 Updraft Vertical Profiles', fontsize=24)

plt.savefig('Vertical_w_prof_14_dec.png', dpi=400)
/Users/mgrover/miniconda3/envs/unidata/lib/python3.7/site-packages/ipykernel_launcher.py:12: MatplotlibDeprecationWarning: Adding an axes using the same arguments as a previous axes currently reuses the earlier instance.  In a future version, a new instance will always be created and returned.  Meanwhile, this warning can be suppressed, and the future behavior ensured, by passing a unique label to each axes instance.
  if sys.path[0] == '':
/Users/mgrover/miniconda3/envs/unidata/lib/python3.7/site-packages/ipykernel_launcher.py:26: MatplotlibDeprecationWarning: Adding an axes using the same arguments as a previous axes currently reuses the earlier instance.  In a future version, a new instance will always be created and returned.  Meanwhile, this warning can be suppressed, and the future behavior ensured, by passing a unique label to each axes instance.